What is an economic recovery and what are the types?
We explain everything you need to know about how an economy recovers from a recession, the different types of recovery, and the trading opportunities that can arise.

What is an economic recovery?
An economic recovery is when an economy is bouncing back from a recession and starting to expand again. Economies move in phases and, once they have contracted and fallen into a recession, they eventually enter a stage of recovery before starting the cycle again.
The recovery starts when the recession bottoms out and ends once the economy has recovered all the gains that were lost. It then gives way to a new era of expansion and a fresh peak.

An economy tends to go through significant change when it enters a recovery. There is a shake-out during a recession. Unsuccessful businesses falter, redundant jobs are lost, investment shifts and everyone reflects on what went wrong in the hope that it won’t happen again.
Dysfunctional and unprepared businesses give way to new innovative start-ups, and those that lose their jobs are eventually employed in more productive jobs.
Read more on recession and what it is
It changes the attitudes of both businesses and consumers, and sparks governments and central banks into action.
Central banks will introduce economic stimulus, governments try to implement schemes to help create new jobs or attract investment, businesses have to innovate and adapt to survive, and consumer’s shopping habits and priorities change.
Read more on whether coronavirus means it’s time for helicopter money
The recession is therefore when lessons are supposed to be learnt about what was wrong with the economy and what needs to change to get it back on track. The response to a recession is what will drive the type and speed of any economic recovery and will also play a significant role in shaping the next period of expansion.
Indicators of an economic recovery
There are two key types of indicators to track in order to judge the state of the economy and where it is headed: lagging and leading indicators. The key difference between the two is that leading indicators can be used to help predict market movements, while lagging indicators confirm trends that are already taking place.
Lagging indicators of an economic recovery
The main lagging indicator to watch is gross domestic product (GDP), as this is what most countries use to measure the size of the overall economy. For example, an economy only technically enters a recession once it has reported two consecutive quarters of GDP contraction. An economy won’t exit recession and enter a recovery until it starts to grow again.
Other lagging indicators of economic recovery include jobs data to examine the condition of a country’s employment, and the consumer price index (CPI) that tracks movements in the price of goods and inflation. Higher employment and rising inflation would confirm that the country’s economy is expanding rather than contracting.

Leading indicators of an economic recovery
For investors and traders, leading indicators are far more important. This is because they can be used to predict where the economy is headed and to provide an edge to your strategy.
Lagging indicators are great for confirming what has happened but provide very limited insight to aide your own predictions.

An economy is amalgamation of everything – jobs, businesses, wages, currency strength, interest rates, consumer confidence, the stock market and so on. Monitoring the performance of individual elements of an economy means you can predict what the overall result will be once the lagging indicators – like GDP – are released.
There is a swathe of popular leading indicators. A rising stock market suggests confidence is growing and businesses are performing better.
PMI (purchasing managers index) informs you whether key sectors like manufacturing or services are expanding or contracting. Consumer confidence surveys give you a glimpse into how people feel about their finances, while retail sales can show how people are spending their money.
The leading and lagging indicators that you need to watch vary depending on what country you are focused on.
Read our guide to the key economic indicators for the UK, US, Asia and Australia
Types of recession and economic recovery
In truth, the economic cycle doesn’t flow as smoothly as the first graph in this article suggests. An economy will have its ups and downs in each phase and one stage can last considerably longer than the other. For example, an economy can contract and then start to expand again without technically entering a recession.
Similarly, economic recoveries can follow different patterns. The type and speed of any economic recovery is often categorised by the letters they end up emulating in charts.
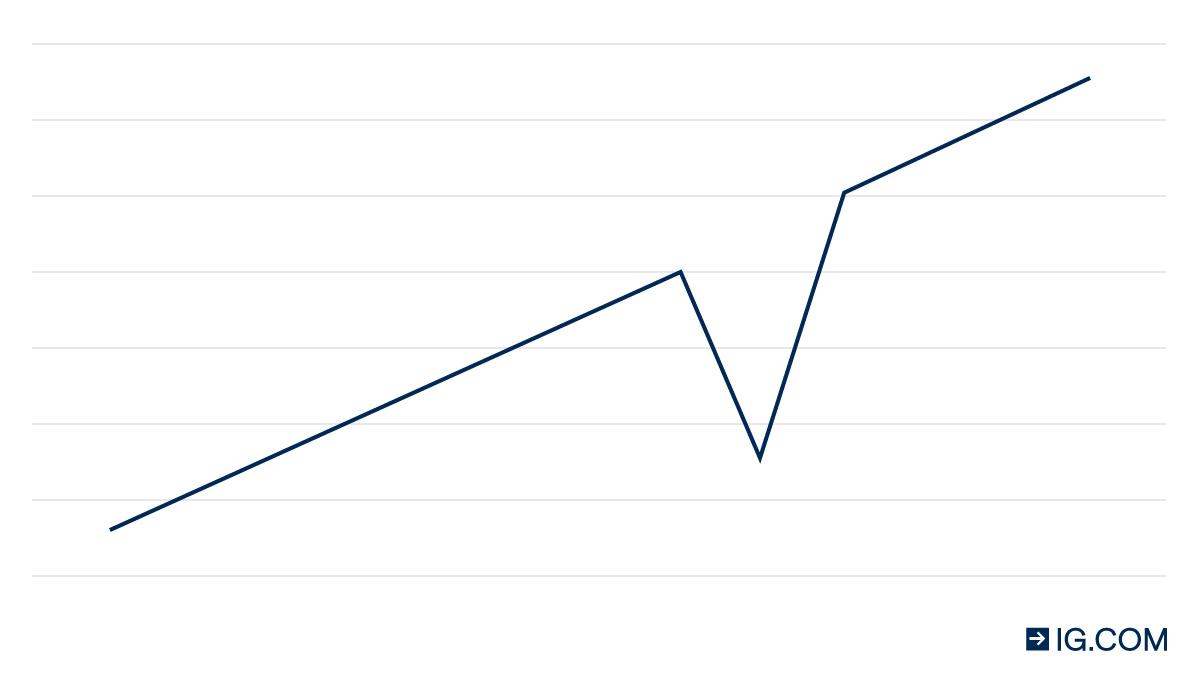
V-shaped recession and economic recovery
A V-shaped recession and economic recovery is all about speed and sharpness. As the below example shows, there can be a sharp contraction in the economy before it experiences an equally sharp recovery to pre-recession levels.
This is treated as the best-case scenario for any economy that enters a recession as it quickly recovers without any complications.

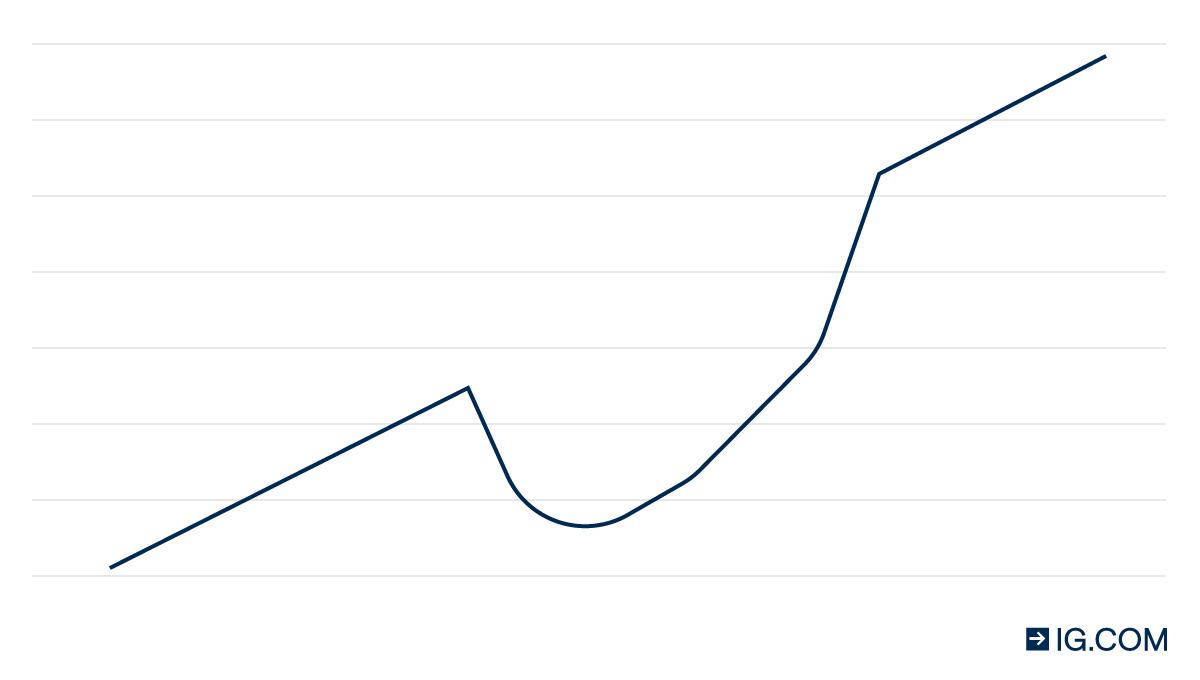
U-shaped recession and economic recovery
A U-shaped recovery sees an economy experience a sharp fall into a recession like the V-shaped scenario, but a more gradual and slower recovery to pre-recession levels.
This means the economy remains depressed for a longer period, possibly for several years, before growth starts to pick up again.

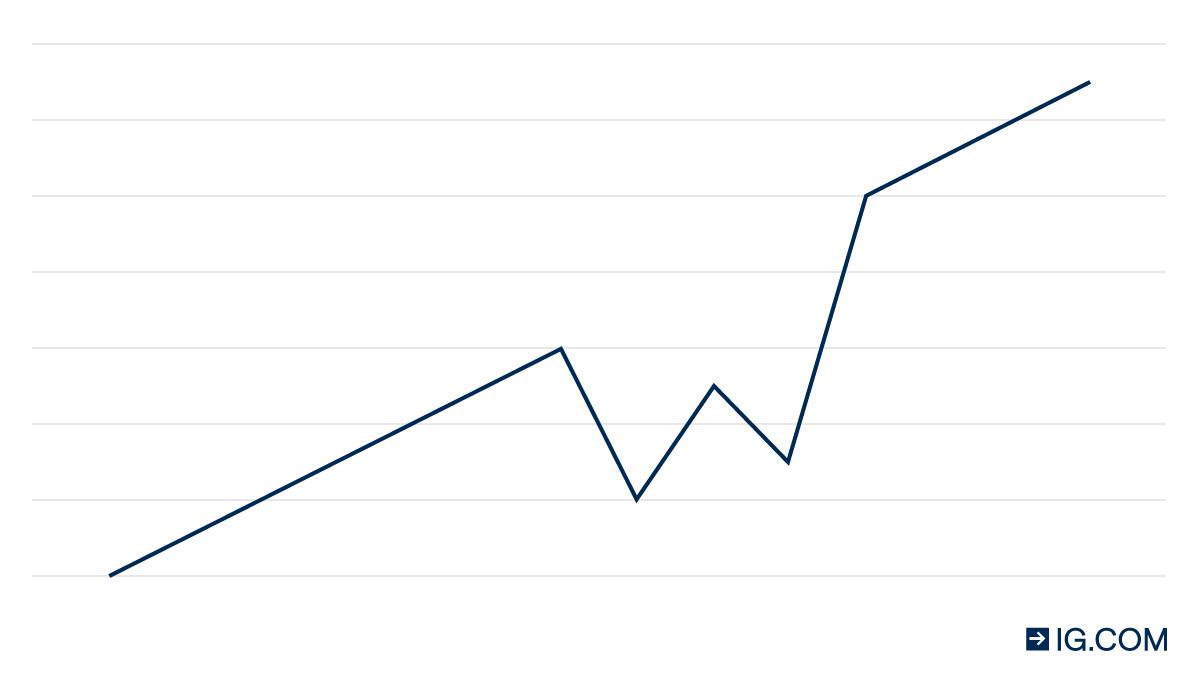
W-shaped recession and economic recovery
W-shaped recessions throw up surprises and are also known as ‘double-dip’ recessions. This is because, at first, it can look like an economy is undergoing a V-shaped recovery before it plunges into a second, often smaller, contraction before fully recovering to pre-recession levels.
Markets are likely to be more volatile under a W-shaped recovery than any of the other letters on this list. Investors and traders can be under the illusion that the economy is about to recover only to find there is another dip.

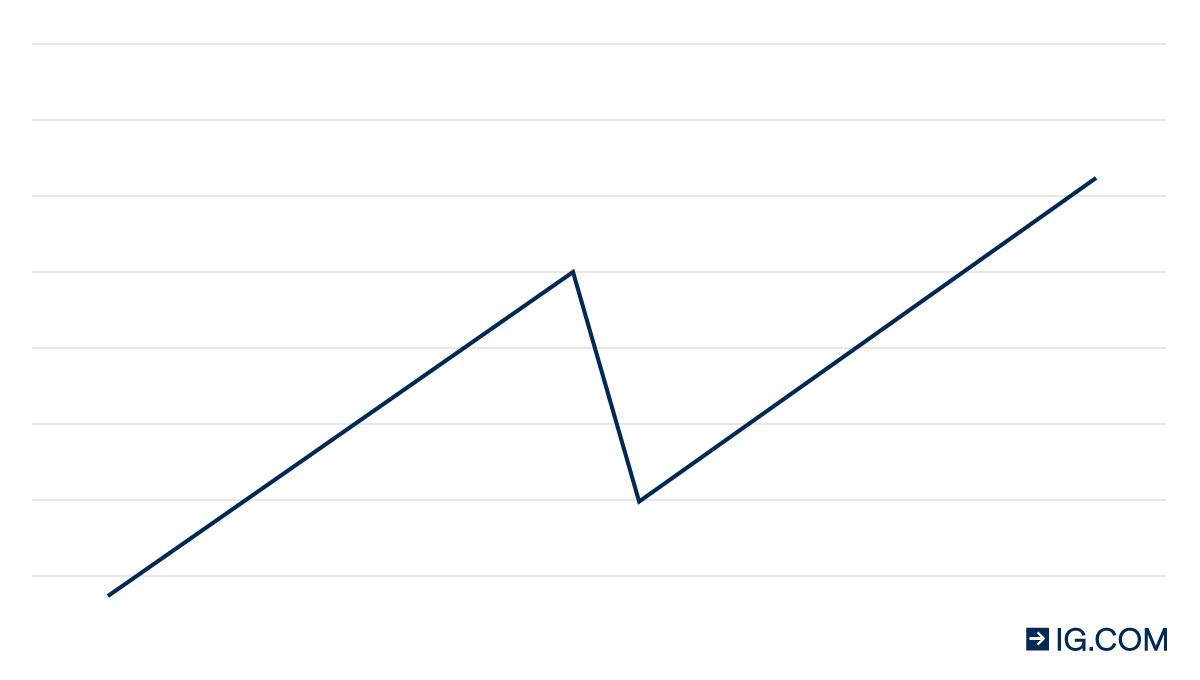
L-shaped recession and economic recovery
An L-shaped recession and recovery is seen as the worst-case scenario. Although the economy returns to growth it is at a much lower base than pre-recession levels, which means it takes much longer to fully recover. This can happen if it there is lacklustre investment levels, low levels of economic growth and a slow revival in employment.

How to trade when an economy is recovering
Recessions and recoveries can provide a window of opportunity for investors and traders, especially during the transition between the two. The decisions taken to protect portfolios during the recession begin to unwind as the economy recovers.
For example, appetite for risk starts to grow again so safe-haven assets begin to fall out of favour. This is why using leading and lagging indicators to determine the outlook for the economy is key for anyone hoping to capitalise.
Stocks generally decline during a recession and rise when an economy starts to recover and expand. However, the stock market tends to move ahead of the overall economy and is often used as a leading indicator to help predict the state of the economy.
The best thing to do is analyse individual company reports to see what sort of companies are starting to deliver improved performances and identify those that will benefit from the recovery. Those that proved resilient during the recession could be best placed to capitalise during the recovery.
It can also be a good time to snap up income stocks on the cheap. If companies that are known for dividends are forced to scrap them when times are hard, it could be the time to buy them in preparation for payouts to resume as the economy recovers.
Read more on how to trade shares
Commodity prices tend to follow a similar pattern when there is a global downturn. Sluggish demand during a global recession puts pressure on the price of everything from oil to copper, but prices tend to rise as demand picks up during a recovery.
However, if a recession is contained to one country or region, commodities tend to hold up because they are needed globally. One commodity that earns a specific mention is gold, regarded as a safe haven asset that stores its value during times of uncertainty.
Investors flee to the metal when they are feeling wary about the future direction of the future economy and take refuge there to protect their investments during a recession, but gold’s performance tends to go downhill as the recovery starts because investors move to higher-risk assets.
Read more on how to trade commodities
The forex market is much more complex, but an area that could be ripe for the taking. It depends on where the recession is happening, whether it is in one major nation or in a bloc of countries that, in terms of trade and finance, are heavily intertwined – like the eurozone.
Currencies always trade in pairs, meaning one has to go up if another is to go down. It’s all about piecing the right conditions with the right country. For example, if there was a global recession then Australia’s recovery could be closely linked to China’s because it exports most of its natural resources to the country – so a pair like AUD/CNH is an example of a pair to watch during a recession and recovery.
Or, if the UK recovered at a slower rate than the eurozone then GBP/EUR could be a pair to watch due to how close the pair’s economies are.
This information has been prepared by IG, a trading name of IG Australia Pty Ltd. In addition to the disclaimer below, the material on this page does not contain a record of our trading prices, or an offer of, or solicitation for, a transaction in any financial instrument. IG accepts no responsibility for any use that may be made of these comments and for any consequences that result. No representation or warranty is given as to the accuracy or completeness of this information. Consequently any person acting on it does so entirely at their own risk. Any research provided does not have regard to the specific investment objectives, financial situation and needs of any specific person who may receive it. It has not been prepared in accordance with legal requirements designed to promote the independence of investment research and as such is considered to be a marketing communication. Although we are not specifically constrained from dealing ahead of our recommendations we do not seek to take advantage of them before they are provided to our clients.

Explore the markets with our free course
Discover the range of markets and learn how they work - with IG Academy's online course.
