Momentum trading strategies: a beginner's guide
Momentum trading is a strategy that uses the strength of price movements as a basis for opening positions. Discover what momentum trading is, how it works and four popular momentum-based indicators you can use to get started.


What is momentum trading?
Momentum trading is the practice of buying and selling assets according to the recent strength of price trends. It is based on the idea that if there is enough force behind a price move, it will continue to move in the same direction.
When an asset reaches a higher price, it usually attracts more attention from traders and investors, which pushes the market price even higher. This continues until a large number of sellers enter the market – for example, when an unforeseen event causes them to rethink the asset’s price. Once enough sellers are in the market, the momentum changes direction and will force an asset’s price lower.
Momentum traders will seek to identify how strong the trend is in a given direction, then open a position to take advantage of the expected price change and close the position when the trend starts to lose its strength. A momentum trader doesn’t necessarily attempt to find the top and bottom of a trend, but instead focuses on the main body of the price move. They aim to exploit market sentiment and herding – the tendency for traders to follow the majority.
Momentum in finance is based on the following key factors:
Volume
Volume is the amount of a particular asset that is traded within a given time frame. Volume is not the number of transactions, but the number of assets traded – so, if five buyers purchase one asset each, it looks the same as if one buyer purchases five of the asset.
Volume is vital to momentum traders, as they need to be able to enter and exit positions quickly, which relies on there being a steady stream of buyers and sellers in the markets. If a market has a high number of buyers and sellers, it is known as a liquid market as it is easier to exchange an asset for cash. Whereas if a market has a low number of buyers and sellers, it is regarded as illiquid.
Volatility
Volatility is a momentum traders’ bread and butter. Volatility is the degree of change in an asset’s price – if a market is highly volatile, it means that there are big price swings, while a market with low volatility is comparatively stable.
Momentum traders will seek out volatile markets, in order to take advantage of short-term rises and falls in an asset’s value. As momentum trading attempts to capitalise on volatility, it is important to have a suitable risk management strategy in place to protect your trades from adverse market movements. This should include stops and limits.
Time frame
Momentum trading strategies are usually focused on short-term market movements, but the duration of a trade can depend on how long the trend maintains its strength. This could make is suitable for traders who employ longer-term styles such as position trading, as well as those who prefer short-term styles, such as day trading and scalping.
Learn more about trading styles and strategies
How to start momentum trading
- Identify the asset you are interested in
- Devise a momentum trading strategy based on technical indicators and analysis
- Practise trading in a risk-free environment using an IG demo account
- Start trading on live markets by opening an account with IG
Alternatively, you can learn more about trading strategies and indicators with IG Academy’s range of online courses.
Popular momentum indicators
Momentum traders aren’t necessarily worried about the fundamentals of the underlying asset – such as its long-term growth prospects and the economic circumstances surrounding it. All a momentum trader generally cares about is price action. This is why most momentum traders rely heavily on technical analysis and indicators to determine when to enter and exit each trade.
Popular momentum indicators include:
Momentum indicator
The momentum indicator is, as you might expect, the most popular momentum indicator. It takes the most recent closing price and compares it to the previous closing price, which can be used to identify the strength of a trend.
The indicator is an oscillator; it is displayed as a single line which moves to and from a centreline of zero (or 100 on some charts). The value of the indicator line provides traders with an idea of how quickly the price is moving. For example, if the indicator gives a reading of 35, this would be a faster uptrend than a reading of 30. If the indicator gave a reading of -15, this would be a faster downtrend than a reading of -10.
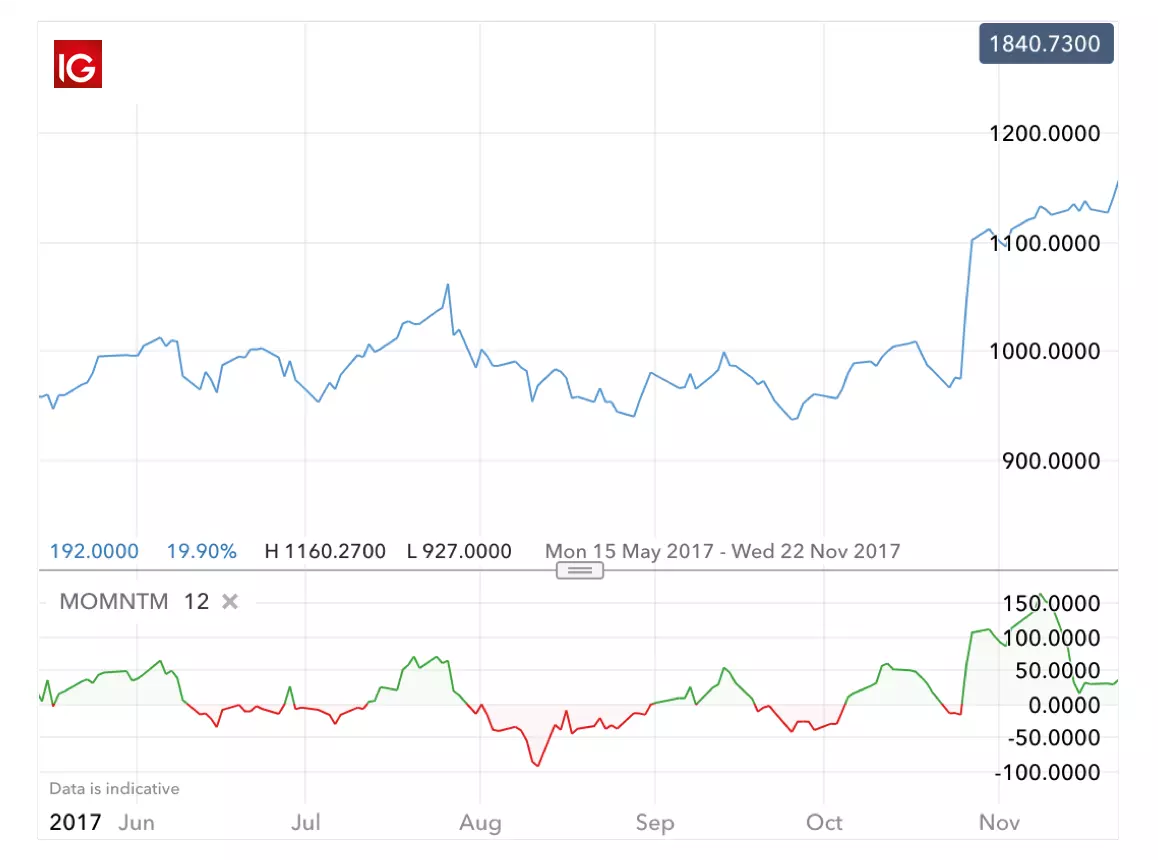
Although some traders will use the indicator to enter and exit traders, most momentum traders will use it to confirm a price action. For example, if the indicator line crosses the zero line from below, it is a sign that the price is starting to gain momentum higher, while a drop below the zero line shows the price is gaining downward momentum.
Relative strength index (RSI)
The relative strength index (RSI) is a momentum-based indicator which provides buy and sell signals. Like the momentum indicator, it is plotted on a separate chart and is an oscillator – moving from zero to 100.
It is similar to other range-bound indicators, in that it provides overbought and oversold signals depending on its value. Anything above 70 is considered overbought, and anything below 30 is considered oversold.
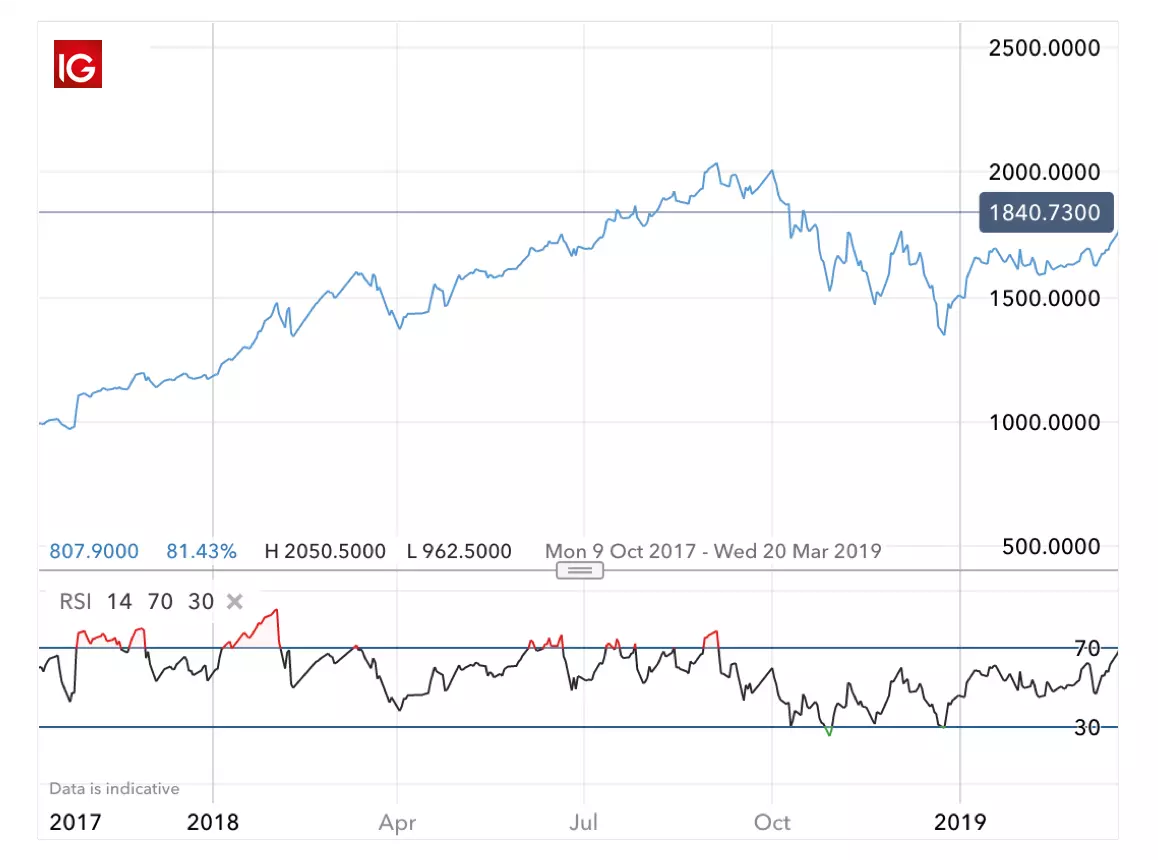
This momentum strategy is based on the idea that retracements between these price levels will present clear trends. Momentum traders would open and close positions within a trend, rather than at the top and bottom.
When using the RSI, it is important to note that just because the indicator gives overbought and oversold signals, doesn’t mean the trend is going to reverse. As you can see from the above price chart, the signal line remained in the overbought territory for a sustained period of time. This makes it important to use the RSI alongside other indicators.
Moving averages
Moving averages (MAs) are used by traders to spot emerging trends in markets. They use a formula that filters out random fluctuations to show a prevailing price trend. Although MAs are not a momentum-based indicator, they can help momentum traders see whether a market is rangebound or not.
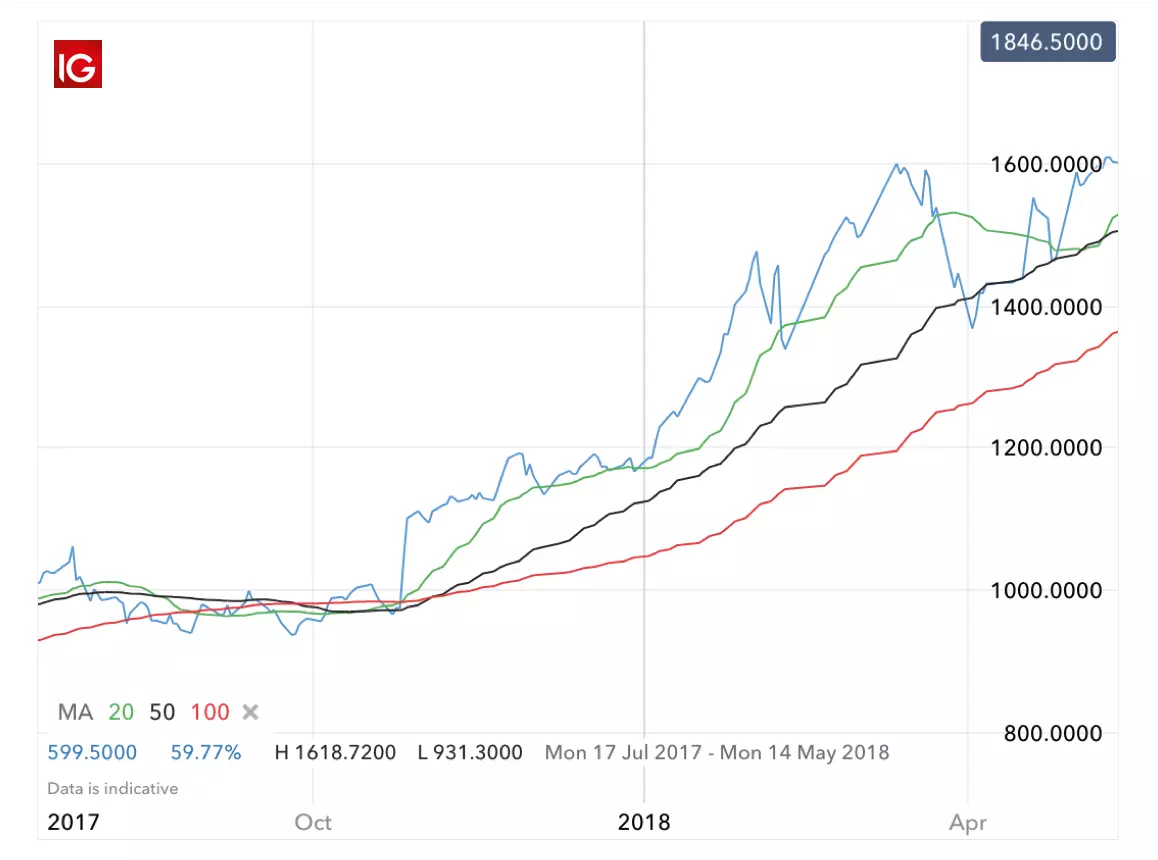
For example, on the above chart there are three moving averages applied: a 15-day, 25-day and 35-day. For the most part of the price action, the moving averages (MAs) are on top of each other, with the shortest-term MA on top and the longest one on the bottom. This tells us that the market is trending, and that the trend is accelerating.
When using moving averages, it is important to be aware that they are a type of lagging indicator – this means that the signals happen after the price move. Although a momentum trader wouldn’t necessarily enter at the start of a trend anyway, this does mean they will need to use other indicators to find a suitable exit point. As you can see from the above chart, the MAs cross over – indicating a trend reversal – after the price has already declined slightly.
Stochastic oscillator
The stochastic oscillator compares the most recent closing price to the previous trading range, over a specified period of time. This indicator does not follow price or volume, but rather the speed and momentum of the underlying market.
The stochastic is considered a leading indicator, so it can be used to predict price movements. It is formed of two lines on a price chart:
- The indicator line: this is a rangebound line that oscillates between zero and 100 – if there is a reading of over 80 the market is considered overbought, and if there is a reading below 20 it is considered oversold
- The signal line: this is drawn onto the same price chart. If the signal line and indicator line cross, it shows that a change in direction is likely to happen
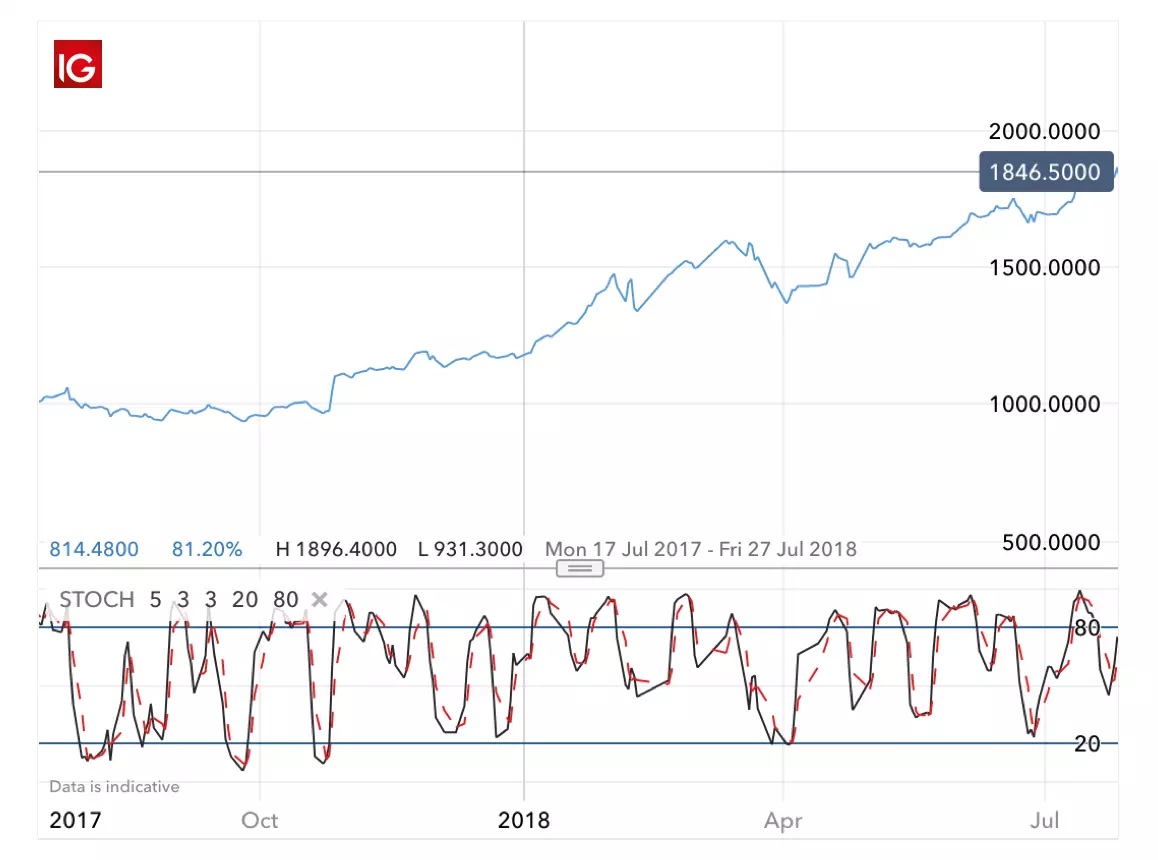
If the stochastic fails to fall back to the 20 mark during a pullback, then it can be taken as a sign that the trend will continue upward. For example, looking at the price chart above, we can see that on the whole the two lines have remained above the oversold signal, and the trend has continued upward. This is an indicator that despite pullbacks, the overall momentum is up.
Momentum trading summed up
- Momentum trading is the practise of buying and selling assets according to the recent strength of price trends
- They will open a position to take advantage of an expected price change and close the position when the trend starts to lose its strength
- Momentum trading is based on volume, volatility and time frames
- Momentum trading works by enabling traders to identify the rate of change in an asset’s price or volume. As neither price or volume will continue in one direction indefinitely, momentum is usually thought of as an oscillating measure
- Momentum traders focus on price action rather than long-term growth and fundamentals
- Popular indicators for momentum trading include the momentum indicator, the RSI, MAs and the stochastic oscillator
This information has been prepared by IG, a trading name of IG Australia Pty Ltd. In addition to the disclaimer below, the material on this page does not contain a record of our trading prices, or an offer of, or solicitation for, a transaction in any financial instrument. IG accepts no responsibility for any use that may be made of these comments and for any consequences that result. No representation or warranty is given as to the accuracy or completeness of this information. Consequently any person acting on it does so entirely at their own risk. Any research provided does not have regard to the specific investment objectives, financial situation and needs of any specific person who may receive it. It has not been prepared in accordance with legal requirements designed to promote the independence of investment research and as such is considered to be a marketing communication. Although we are not specifically constrained from dealing ahead of our recommendations we do not seek to take advantage of them before they are provided to our clients.

Explore the markets with our free course
Discover the range of markets and learn how they work - with IG Academy's online course.