Alibaba share price tumbled 11% towards two-year-low after big earning miss
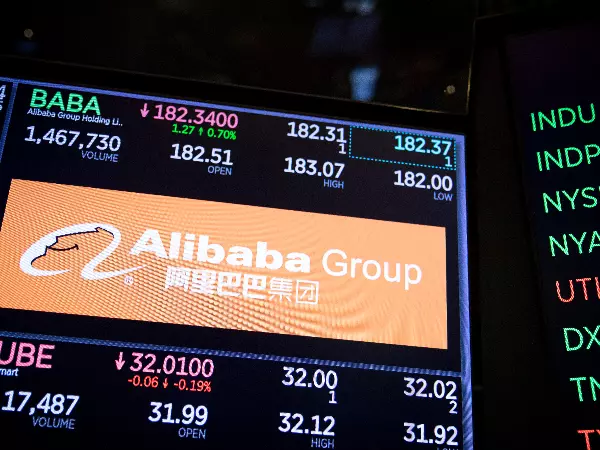
China’s top tech giant Alibaba experienced one of its worst days in US share market. Its share price (NYSE: BABA) dropped harshly by 11% from $161, the day before, to $143 when market closed on Thursday.

Even through a 4.07% drop before the report day showing Alibaba Group Holding Ltd (24 Hours) investors had little expectation for the Chinese ecommerce giant given all the bumpy hurdles that it had gone through, the disappointing Q2 earnings still dragged the BABA’s share price down much further.
What does the Q2 earnings show?
Based on Alibaba’s Q2 earnings, the ecommerce giant reported non-GAAP earnings per share (EPS) of $1.74, missing the estimate of $1.93, representing a shocking 37.7% decline compared to the same period last year. Revenue was also reported as a miss, totalling $31.15 billion as opposed to the estimated $32.05 billion.
Annual active consumer globally is the only beat that has reached approximately 1.24 billion, more than four-times the size of Amazon (300 million), with a quarterly net increase of 62 million consumers.
Alibaba earnings results
Metric |
Beat/miss/match |
Reported value |
Analysts prediction |
| Adjusted EPS | Miss | RMB 11.20 | RMB 12.11 |
| Revenue | Miss | RMB 200.7B | RMB 205.7B |
| Annual active consumers in China | Beat | 953 M | 846.6 M |
Source: VisibleAlpha
Quarterly earnings surprise amoune
Fiscal quarter end |
Date reported |
Earnings per share |
Consensus EPS forecast |
% Surprise |
September 2021 |
18/11/2021 |
1.75 |
1.93 |
-9.3 |
June 2021 |
8/03/2021 |
2.16 |
1.74 |
24.1 |
March 2021 |
05/13/2021 |
1.1 |
1.41 |
-22.0 |
December 2020 |
2/02/2021 |
2.98 |
2.78 |
7.2 |
September 2020 |
11/05/2020 |
1.32 |
1.65 |
-20.0 |
Source: Nasdaq.com
Why is the market disappointing?
Fundamentally, investors are concerned about the company’s long-term profitability. Although the group’s revenue still grew by 29% year-over-year, its adjusted EBITA margin for the most profitable sector ‘commerce’ decreased from 35% in the quarter ending 30 September 2020 to 19% a year after, shrinking by a worrying 45%. Alibaba didn’t deny thinner margin in the report, stating “we expect that our commerce adjusted EBITA margin will continue to be affected by the pace of our investment in key strategic areas”.
Actually, Alibaba's operating margin has been declining for some time. In 2014, the company’s margin sat at around 45% when their active user size was only one-fourth of what it is today. This means the ecommerce giant’s margin has been reducing by an average of 12% every year.
Adjusted EBITA and adjusted EBITA margin by segments (in millions, except percentages)
|
|
2020 |
|
2021 |
|||
|
RMB |
Margin |
RMB |
US$ |
Margin |
|
Commerce |
45,958 |
35% |
33,270 |
5,163 |
19% |
|
Cloud computing(1) |
-567 |
-4% |
396 |
61 |
2% |
|
Digital media and entertainment |
-710 |
-9% |
-931 |
-144 |
-12% |
|
Innovation initiatives and others(1) |
-1,970 |
-189% |
-2,882 |
-447 |
-201% |
|
Source: Alibaba
On the other hand, Alibaba’s challenge is not just a matter of fundamental valuation, but a matter of risks. As the open window into the impact of Beijing’s regulatory curbs, Alibaba coincided other Chinese stocks listed in the U.S. are reporting similar troubling results this quarter. For example, Tencent last week reported its slowest revenue growth since 2004, fuelled with the growing concern over the company’s long-term picture under the environment that was walloped by macroeconomic and regulatory turmoil.
Alibaba technical analysis
Over the past twelve months, Alibaba's shares have provided a total return of -37.1%, well below the US 500's total return of 29.9%.
From a technical standpoint, the freefall from this week has left a big gap between $146 to $160, which became the critical resistance level if the price is seeking higher in the near term. The candlestick is now sitting in the previous gap from October, with the support level at $139. If the bearish momentum stays, a further down to two-year-low at $130 may be in view.

Take your position on over 13,000 local and international shares via CFDs or share trading – and trade it all seamlessly from the one account. Learn more about share CFDs or shares trading with us, or open an account to get started today.
This information has been prepared by IG, a trading name of IG Australia Pty Ltd. In addition to the disclaimer below, the material on this page does not contain a record of our trading prices, or an offer of, or solicitation for, a transaction in any financial instrument. IG accepts no responsibility for any use that may be made of these comments and for any consequences that result. No representation or warranty is given as to the accuracy or completeness of this information. Consequently any person acting on it does so entirely at their own risk. Any research provided does not have regard to the specific investment objectives, financial situation and needs of any specific person who may receive it. It has not been prepared in accordance with legal requirements designed to promote the independence of investment research and as such is considered to be a marketing communication. Although we are not specifically constrained from dealing ahead of our recommendations we do not seek to take advantage of them before they are provided to our clients.
Introducing our best ever web platform
Enhance your CFD trading with the new IG Trading platform:
Quicker deals, with one-click execution from lists
Real-time updates, with news and Twitter feeds
Orders to part close, price change alerts, a dark theme and more

Live prices on most popular markets
- Forex
- Shares
- Indices