FTSE 100 & Dax hold firm, but Nasdaq 100 struggles ahead of tech earnings
The action-packed week has meant that indices are struggling to make headway, with the Nasdaq 100 under pressure as big tech companies prepare to report earnings.


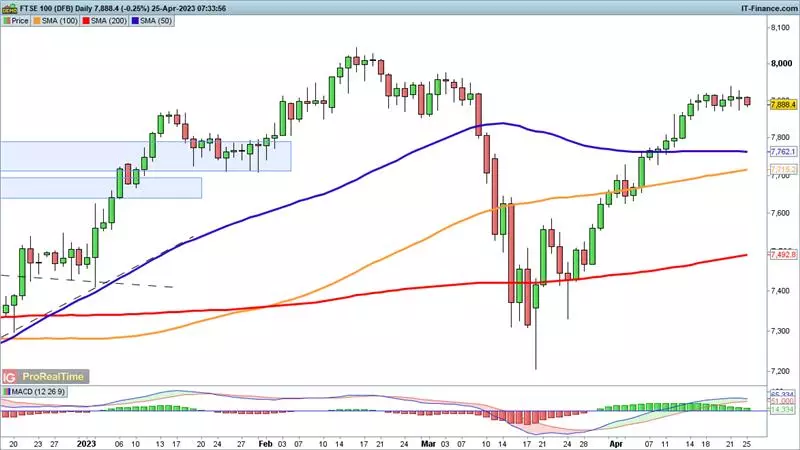
FTSE 100 consolidation goes on
The index continues to consolidate around 7900, as it has done for around a week.
The huge rebound from the lows of March has slowed, but it has yet to turn lower, with the 7870 area defended by buyers for the time being. A fresh turn lower may bring the 50-day Simple Moving Average (SMA) into view as support.
Meanwhile, further upside above 7940 would put the index on course to target 8000 and higher.
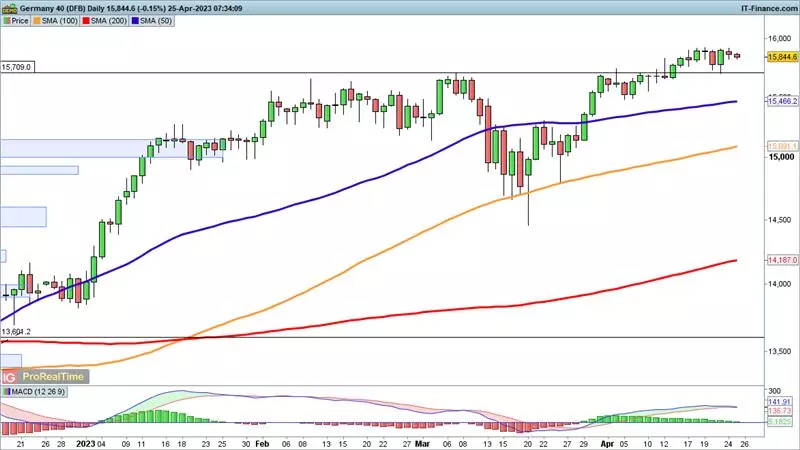
Dax clings on near one-year highs
The price is holding around the one-year+ highs reached in mid-April.
In the short-term, the nearest target to the upside is 16,130, last seen in early January 2022. Beyond this are the highs at 16,288 and 16,298.
Gains have been hard to sustain, but sellers have been unable to hold the price below 15,800. Should this and then 15,700 be broken a more dramatic move to the downside may develop.
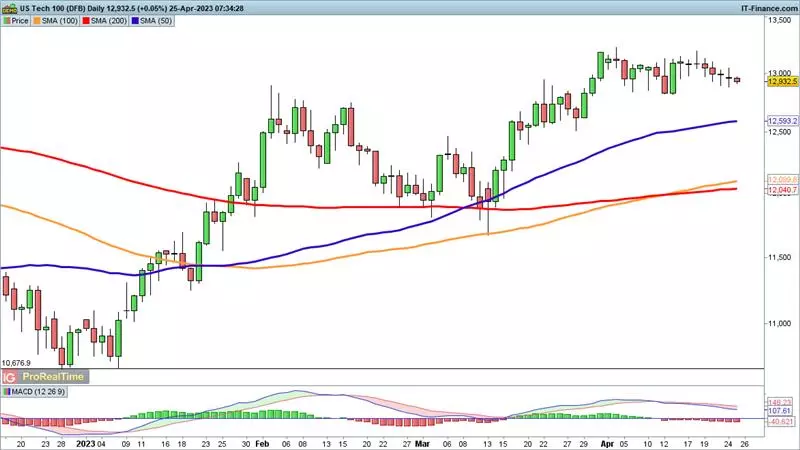
Nasdaq 100 weaker as investors await tech earnings
The index has drifted lower ahead of key earnings from big US tech stocks this week.
A declining MACD points towards a continued inability to push higher, but the overall uptrend is intact after the index clocked up a higher high at the end of March.
A revival would put the index back on a path to the August 2022 highs at 13,715.
This information has been prepared by IG, a trading name of IG Australia Pty Ltd. In addition to the disclaimer below, the material on this page does not contain a record of our trading prices, or an offer of, or solicitation for, a transaction in any financial instrument. IG accepts no responsibility for any use that may be made of these comments and for any consequences that result. No representation or warranty is given as to the accuracy or completeness of this information. Consequently any person acting on it does so entirely at their own risk. Any research provided does not have regard to the specific investment objectives, financial situation and needs of any specific person who may receive it. It has not been prepared in accordance with legal requirements designed to promote the independence of investment research and as such is considered to be a marketing communication. Although we are not specifically constrained from dealing ahead of our recommendations we do not seek to take advantage of them before they are provided to our clients.

Take a position on indices
Deal on the world’s major stock indices today.
- Trade the lowest Wall Street spreads on the market
- 1-point spread on the FTSE 100 and Germany 40
- The only provider to offer 24-hour pricing
Live prices on most popular markets
- Forex
- Shares
- Indices