Where to next for the S&P 500: up or down for the rest of the year?
H2 2023 outlook on the S&P 500 amid probable monetary tightening, lower liquidity and recessionary fears.


S&P 500 hits a near ten-month high as shorts once again get squeezed
The US 500 has managed to rise close to its August 2022 peak at 4,325.28 as the US government has - for the 79th time since 1960 - agreed to raise its debt ceiling.
In doing so, several shorts have once more been squeezed, pushing the index to its current June high at 4,299.28.
Has this year’s rally got wings?
With, according to the Chicago Mercantile Exchange (CME), the probability of no Federal Reserve (Fed) rate hike at the June meeting rising to 75%, further short-term upside may perhaps be on the cards from a fundamental point of view.
Since a July rate hike, for now at least, is still priced in and as the fundamental picture may worsen in the months to come, the odds for a prolonged rally seem to diminish, however.
At a time when the contrarian CNN Fear & Greed Index has entered “extreme greed” in the, for western stock markets, historically unfavourable period of the year between May and October, investors seem blasé about this year’s 11% advance in the S&P 500 with volatility dropping to extremely low levels.
CNN Fear & Greed Index chart
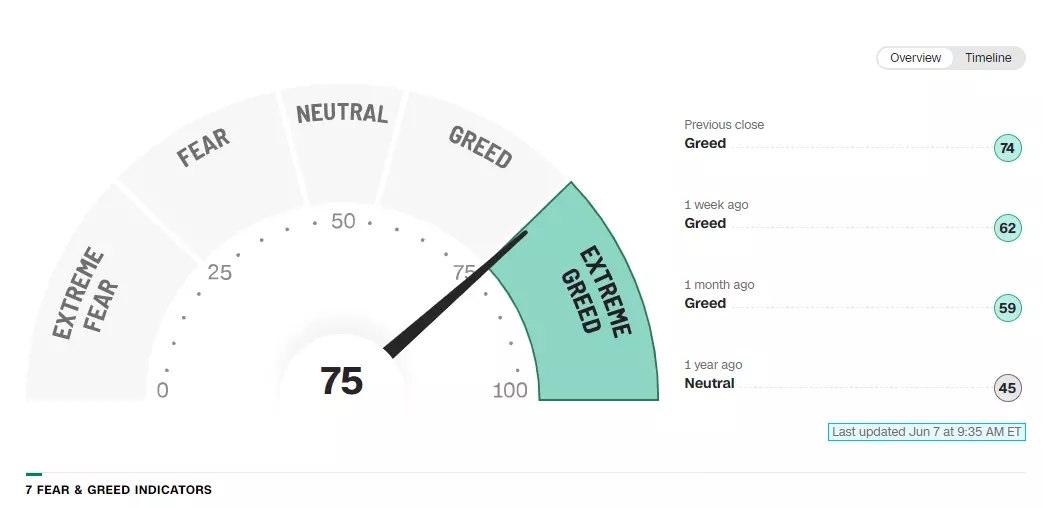
This could mean that there is a bumpy and less rosy road ahead for the S&P 500 until the end of the year.
Fundamental reasons for the S&P 500 to decline before the end of the year
Five fundamental reasons why we are unlikely to see a repeat of the positive first half performance in the S&P 500 in the second half of the year are:
1) When volatility drops to extremes, investors tend to overlook risks and stock markets may top out;
2) An inverse yield curve, once it reverts, tends to lead to a recession, pushing equity markets down;
3) The raising of the US debt ceiling is going to drain liquidity;
4) The S&P 500 rally year-to-date is not supported by market breadth;
5) Can over 300 institutional investors in the US be wrong?
Let’s elaborate: 1) the Chicago Board of Options Exchange (CBOE) VIX volatility index is trading in multi-month lows, and it’s a similar story for the Russell 2000 (RVX), German VDAX and Emerging Markets (VXEEM) volatility indices, showing general complacency.
But this extreme low volatility can also be seen outside of the stock market sphere on the Crude Oil (OVX), Gold (GVZ) and Euro Currency Volatility indices.
Since periods of low volatility are usually followed by periods of high volatility, which often, but not always, accompany market tops, one should at least be aware of this risk.
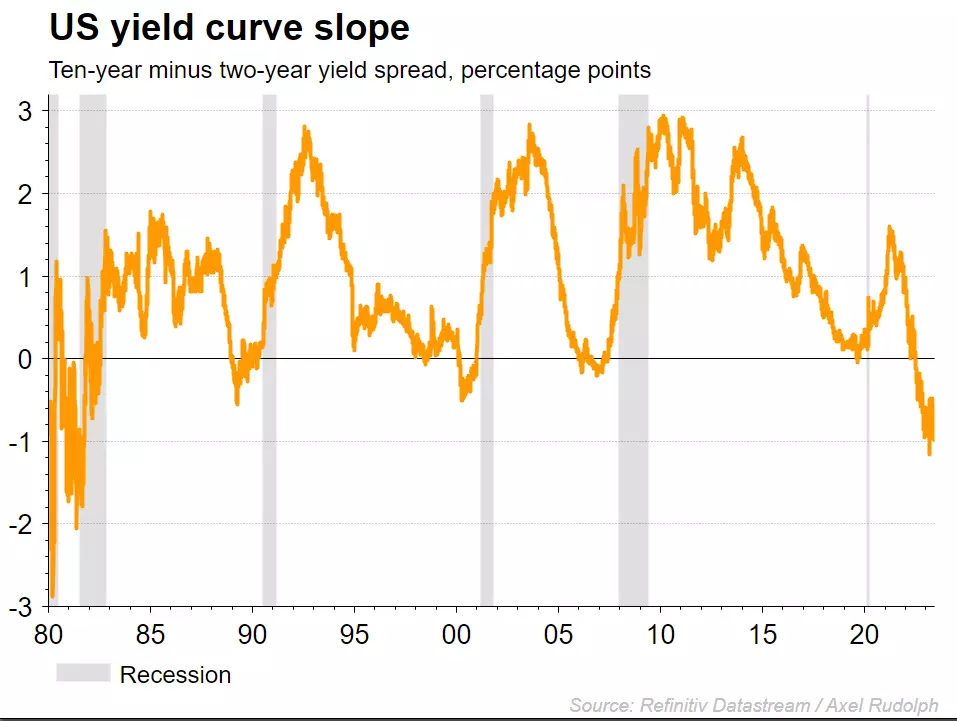
2) The US yield curve is likely to re-invert later this year, meaning that at some stage the short-term yields will be trading back below the long-term yields.
The problem is that each time the yield curve has re-inverted since the 1980’s, it provoked a recession. This in turn led to equity bear markets rearing their head or at least significant corrections taking place.
Inverted US yield curve and recession chart
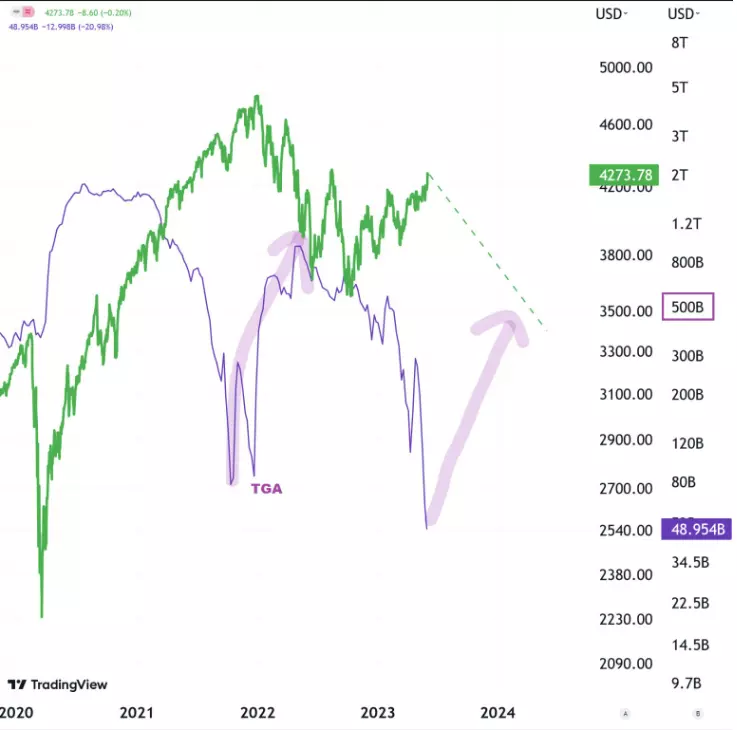
3) Now that the US government has agreed to raise its debt ceiling, the Treasury General Account (TGA) needs to be replenished which will drain lots of liquidity out of the market. This usually leads to a fall in stock prices.
TGA overlaid on S&P 500 line chart
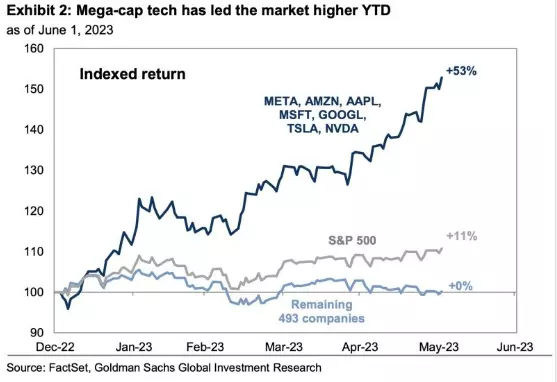
4) The S&P 500’s advance this year has been driven by fewer stocks than in the 2000 dotcom bubble and fewer than during the 2008 financial crisis, actually by fewer stocks than at any time in the last 30 years.
The seven largest companies in the S&P 500 index now have a market cap greater than the Energy, Materials, Industrials, and Financials sectors combined!
It is thus fair to say that at a time when the differential between credit card debt versus savings in the US is at an all-time record extreme, this year’s stock market rally is driven by only seven mega caps.
According to Goldman Sachs Global Investment Research, the share prices of Alphabet, Amazon, Apple, Meta, Microsoft, Nvidia and Tesla have collectively risen by over 50% year-to-date, the S&P 500 by 11% with the remaining 493 stocks flatlining.
US Mega-cap technology, S&P 500 and remaining 493 companies performance chart
5) In the latest S&P Global survey, return expectations regarding the US equity market have deteriorated to their lowest level ever.
Unless over 300 institutional investors are all wrong, which is unlikely to be the case for a prolonged period of time, stock markets are likely to take a hit at some stage over the summer or later this year.
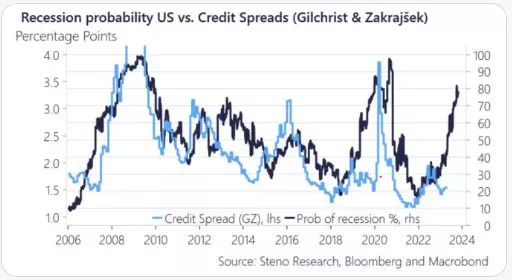
This is especially the case since the probabilities regarding a US recession seem to be increasing and are reaching levels last seen during the pandemic.
US recession probability versus credit spreads chart
Possible fundamental reasons for the S&P 500 to continue its 2023 ascent?
Five fundamental reasons why stock markets could rally further.
1) Core inflation is finally falling;
2) Better-than-expected corporate earnings lead to more share buying;
3) China’s lacklustre growth suddenly picks up, perhaps because of another stimulus plan;
4) Two consecutive positive quarters usually lead to further upside;
5) Historically the S&P 500 has averaged a 6.7% gain in the six months following mega cap outperformance streaks.
With regards to the first point, while headline inflation has been falling, core inflation in the US remains stubbornly high at 5.5%. If it were to rapidly fall, the economic picture could improve, confidence return and stock markets push higher still.
2) Q2 and Q3 corporate earnings could once again surprise to the upside, like they have done for many of the larger US stocks in Q1, pushing equity indices such as the S&P 500 higher still.
3) China, where a number of banks this week said that they would cut deposit rates, providing some support for profit margins and the broader economy, may announce another wide-ranging stimulus plan. This could accelerate growth in the world’s second largest economy and boost share prices globally.
4) Going back to the 1950’s, when the S&P 500 has had two consecutive positive quarters after a bear market, it usually continues to rise over the following quarters.
5) Another fact is that historically the S&P 500 has averaged a 6.7% gain in the six months following mega cap outperformance streaks, such as the one we are witnessing at the moment.
S&P 500 performance after over five consecutive months of mega cap outperformance chart

What does technical analysis say?
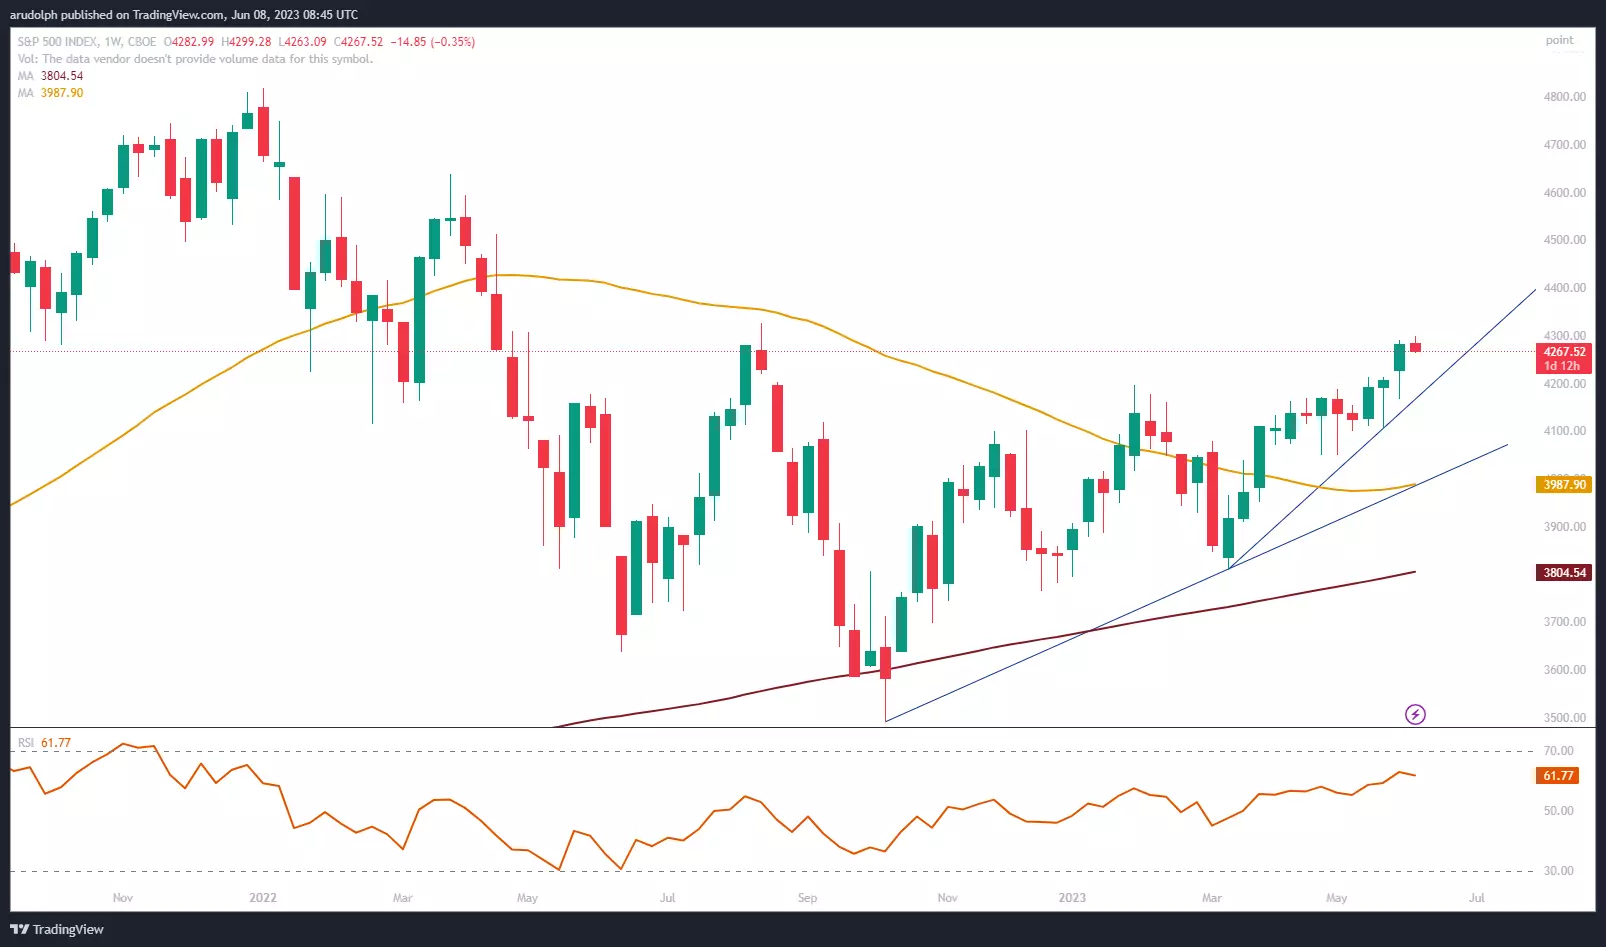
With volatility falling by the wayside as the S&P 500 is approaching its August 2022 peak, investors seem to be getting complacent with regards to a possible top forming.
S&P 500 Weekly Chart
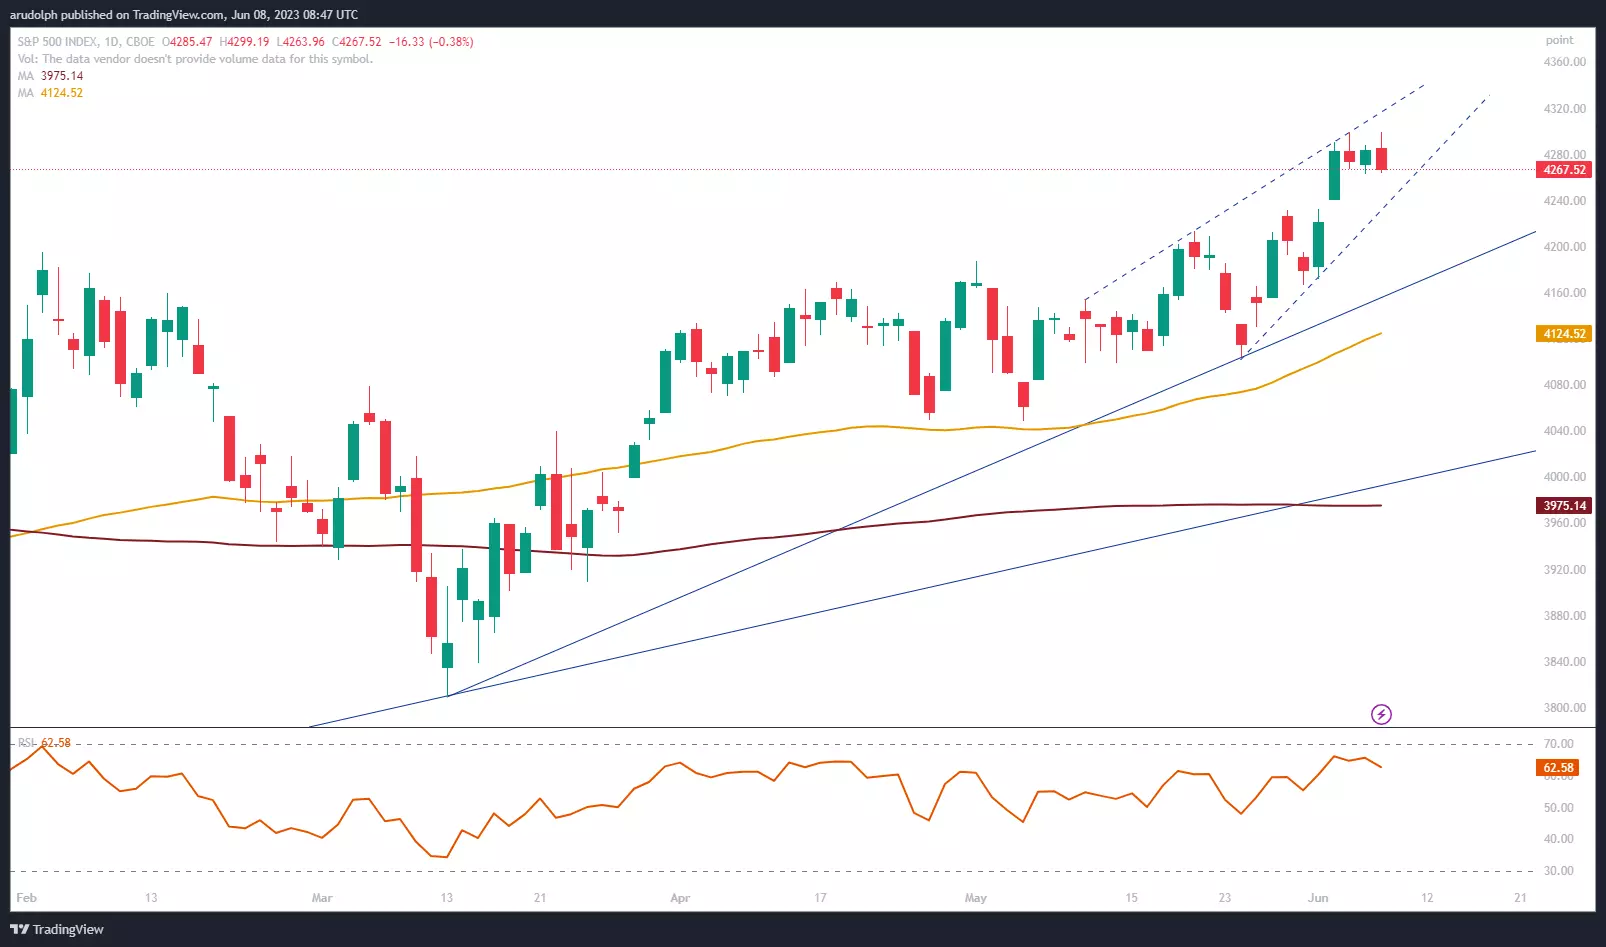
The fact that a minor rising wedge formation can be spotted on the daily chart may point to at least a short-term top soon being formed.
For this to be the case, a slip through and daily chart close below the one-month tentative support line at 4232.00 would need to be seen. Confirmation of a more significant correction lower taking place would be a fall through the 24 May low at 4,103.98.
In this case the 200-day simple moving average (SMA) at 3,975.14 would be back on the radar over the northern hemisphere summer months.
S&P 500 Daily Chart
Unless the above mentioned technical support levels get taken out, the March-to-June uptrend remains intact, however.
A rise and weekly close above the August 2022 peak at 4,325.28 would open the way for the August 2021, January and March 2022 highs at 4,545.85 to 4,637.30 to be reached.
Given the current complacency and fear of missing out in the bull market by retail investors, low volatility, growing tail risks and potential technical reversal signals, a bullish scenario for the second half of the year looks less likely than a bumpy one.
After all, stock markets rarely go up in a straight line.
This information has been prepared by IG, a trading name of IG Australia Pty Ltd. In addition to the disclaimer below, the material on this page does not contain a record of our trading prices, or an offer of, or solicitation for, a transaction in any financial instrument. IG accepts no responsibility for any use that may be made of these comments and for any consequences that result. No representation or warranty is given as to the accuracy or completeness of this information. Consequently any person acting on it does so entirely at their own risk. Any research provided does not have regard to the specific investment objectives, financial situation and needs of any specific person who may receive it. It has not been prepared in accordance with legal requirements designed to promote the independence of investment research and as such is considered to be a marketing communication. Although we are not specifically constrained from dealing ahead of our recommendations we do not seek to take advantage of them before they are provided to our clients.

Take a position on indices
Deal on the world’s major stock indices today.
- Trade the lowest Wall Street spreads on the market
- 1-point spread on the FTSE 100 and Germany 40
- The only provider to offer 24-hour pricing
Live prices on most popular markets
- Forex
- Shares
- Indices