Gold and oil head down while corn prices stabilise
Gold and oil prices are down despite the gains towards the end of last week, while corn has held its ground.
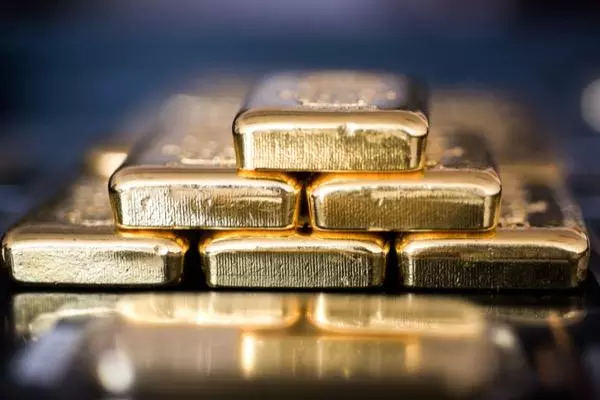

Gold weakens in early trading
Gold saw its gains from last week ebb away on Friday, as the dollar strengthened following the solid non-farm payrolls (NFP) report.
The commodity had made headway over the week, rallying back above the 200-day simple moving average (SMA), but gains have stalled below $1870.
Above $1875 the price would head towards the 50-day SMA (currently $1890), and then on towards $1907.
A broader move to the downside requires the price to drop back below $1830, which would then bring the May low at $1787 into view.

WTI boosted by Saudi price increase
Oil prices continue their steady climb, pushed along by the sharp rise in prices by Saudi Arabia.
As yet there appears to be no sustained decline in demand expectations, and with lockdowns in China being eased we can expect a recovery in economic activity there.
The price now targets the March high at $126.74, having cleared the high from the second half of March at $114.83. Rising trendline support from the May low at $98.45 provides a firm bullish outlook. It would require a move back below $110 to suggest that a fresh move to the downside is underway.

Corn prices stabilise
Prices for this commodity have retreated since the April high, but expectations of further tight supply have seen support begin to emerge just above the $7.00 level.
A rebound from current levels, bolstered by fears about reduced levels of exports from Russia and Ukraine, would target trendline resistance from the late April high. From here $7.77 and $8.17 come into view.
A deeper retracement below $7.03 would potentially signal a reversal towards the 200-day SMA at $6.39.

This information has been prepared by IG, a trading name of IG Australia Pty Ltd. In addition to the disclaimer below, the material on this page does not contain a record of our trading prices, or an offer of, or solicitation for, a transaction in any financial instrument. IG accepts no responsibility for any use that may be made of these comments and for any consequences that result. No representation or warranty is given as to the accuracy or completeness of this information. Consequently any person acting on it does so entirely at their own risk. Any research provided does not have regard to the specific investment objectives, financial situation and needs of any specific person who may receive it. It has not been prepared in accordance with legal requirements designed to promote the independence of investment research and as such is considered to be a marketing communication. Although we are not specifically constrained from dealing ahead of our recommendations we do not seek to take advantage of them before they are provided to our clients.
Two ways to trade and invest
CFDs・Share trading
Australia's No.1 CFD provider1. Trade 18,000+ markets and invest in shares with $0 commission.4
Start trading
Available on web, iOS and Android.
Crypto・Shares・ETFs
Invest in crypto2, shares, and ETFs, in a simple, all-in-one investing app. Get started with just $2.
Start investing
Available on iOS and Android only.
Crypto is offered by IG Digital Assets Australia and is unregulated.


IG MARKETS · NEW
All-in-one app for shares, ETFs and crypto
Buy, hold and manage real shares, ETFs and crypto in one clean app. AUSTRAC-registered and fully reserved. Crypto is offered by IG Digital Assets Australia and is unregulated.
Built for simplicity
A clean, mobile-first app that makes owning crypto easy.
Security, sorted
Your assets stay yours. Held 1:1, independently audited and AUSTRAC-registered.
Real support
Australian specialists by live chat and WhatsApp, plus 24/7 virtual assistance.
IG TRADING
Everything you need to trade
Trade 18,000+ markets and invest in Australian, US and UK shares with $0 commission per trade4 and only a 0.7% FX fee on international trades.
CFD Trading
Go long or short on shares, indices, forex, commodities and crypto with leverage.
Share Trading
Buy and own real Australian & global shares with $0 commission.
Platforms & tools
Web, mobile, MT4, ProRealTime and TradingView with advanced charting tools.


Learn as you go
Whether you're just starting out or sharpening your edge, we've got the tools to help you grow.
Live prices on popular markets
- Popular markets
- Indices
- Forex
- Shares
Choose an award-winning platform5

What our clients say about us
Ready to trade or invest?
Open an account in minutes and get started today.
Ready to trade or invest?
Open an account in minutes and get started today.
* T&Cs apply. Read the terms and conditions of the promo here.
1 Number 1 in Australia by primary relationships, CFDs & FX, Investment Trends November 2024 Leveraged Trading Report.
2 IG Digital Assets Australia Pty Ltd (ABN 686 210 462) is registered with AUSTRAC as a Digital Currency Exchange provider. Cryptocurrency trading is highly speculative and volatile. The cryptocurrency market is unregulated and you do not benefit from Investor protections available for regulated financial products. Cryptocurrencies are not covered by the Australian Financial Complaints Authority (AFCA) scheme. You may lose all of your investment. The purpose of this website is solely to display information regarding the products and services available on the IG Markets App. It is not intended to offer access to any of such products and services. You may obtain access to such products and services on the IG Markets App.The information on this website does not take into account your objectives, financial situation or needs. You should consider whether cryptocurrency trading is appropriate for you in light of your circumstances and seek independent financial advice before deciding to trade.
3 IG Australia is part of IG Group Holdings Plc, a member of the FTSE 100.
4All trading involves risk. $0 commission applies to clients who trade on the IG share trading account and opt for the default setting of ‘instant currency conversion’. Clients who choose to convert currencies manually will pay commission of 2 cents per share with a minimum charge of $10 on US stocks and, for European markets, we charge £10 / €10 per trade or 0.1%, whichever is higher. Other fees and charges may apply, please see our share trading cost and charges page.
5 Winner of ‘Best Multi-Platform Provider’, ‘Best Platform for the Active Trader’, ‘Best Finance App’ and ‘Best Online Stockbroker’ at the ADVFN International Finance Awards 2025; Canstar 5-Star Award for Outstanding Value – Online Share Trading for Casual Investor, Active Investor and Trader categories; Moneymagazine Best of the Best 2025: Best-Value Feature-Packed Premium Share Broker.
Live prices on most popular markets
- Forex
- Shares
- Indices