Dow Jones, SP500 and Nasdaq 100 index prices consolidate gains
Major US indices the Dow, S&P500 and Nasdaq100 have all produced medium term trend reversals, although longer term trends paint a mixed picture.
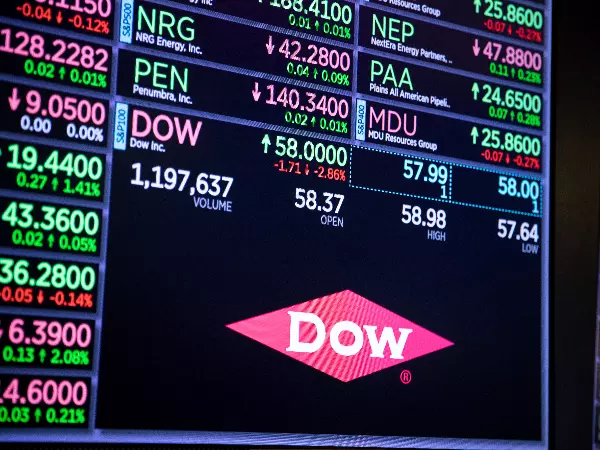

Dow Jones (Wall Street)

The Wallstreet 30 index price now trades firmly above the 200 day (blue line), 50 day (green line) and 20 day (red line) moving averages (MAs). The 20MA has been trading above the 50MA for a few weeks now suggesting that the short to medium term trends are up. The price having recently moved above the 200MA suggests the longer term downtrend has been broken.
The index is however in overbought terriotry. The overbought signal is considered to carry less relevance than the prevailing trends, although does lower the confidence of our further upside assumptions for the Wallstreet 30 index.
The index price has recently retraced from the short term highand has moved into a consolidation between levels 33180 (support) and 34100 (resistance). The consolidation could be serving as a correction of the recent move higher.
Our preference is to keep a long bias to trades, although first wait for either a bullish price reversal off range support (33180) or a break of resistance at 34100 (confrimed with a close) for entry.
Should the price instead move to close below support at 32970 we would need to reassess our long preference to trades on the index right now.
SP500 (US500)

The SP500’s recent move higher has been less pronounced than that of its Dow Jones industrial peer. The index has however also produced a short to medium term trend reversal (from down to up) highlighted by the 20MA crossing above the 50MA. The price has not yet moved above the 200MA to confirm a break of the longer-term downtrend.
Traders looking for long entry might prefer to see the 200MA broken with the price closing above this level as well as above resistance at 4000. In which case 4150 becomes a near term upside target from the move. In this scenario traders could look at trailing a stop loss on a close below the dotted trend line on the chart above.
Nasdaq100 (US Tech100)

The Nasdaq 100 index is lagging its SP500 and Wall Street peers, although the index has however also produced a short to medium term trend reversal (from down to up) highlighted by the 20MA crossing above the 50MA. The longer-term trend is still considered down as the price continues to trade firmly below the 200MA.
Our preference on the Nasdaq 100 is to remain market neutral while we assess whether we are in a correction of the longer-term downtrend or start of a new uptrend.
This information has been prepared by IG, a trading name of IG Australia Pty Ltd. In addition to the disclaimer below, the material on this page does not contain a record of our trading prices, or an offer of, or solicitation for, a transaction in any financial instrument. IG accepts no responsibility for any use that may be made of these comments and for any consequences that result. No representation or warranty is given as to the accuracy or completeness of this information. Consequently any person acting on it does so entirely at their own risk. Any research provided does not have regard to the specific investment objectives, financial situation and needs of any specific person who may receive it. It has not been prepared in accordance with legal requirements designed to promote the independence of investment research and as such is considered to be a marketing communication. Although we are not specifically constrained from dealing ahead of our recommendations we do not seek to take advantage of them before they are provided to our clients.
Live prices on most popular markets
- Forex
- Shares
- Indices