Gold tries to break higher, while Brent crude holds steady and natural gas price rises
Gold tries to break higher, while Brent crude holds steady and natural gas price rises


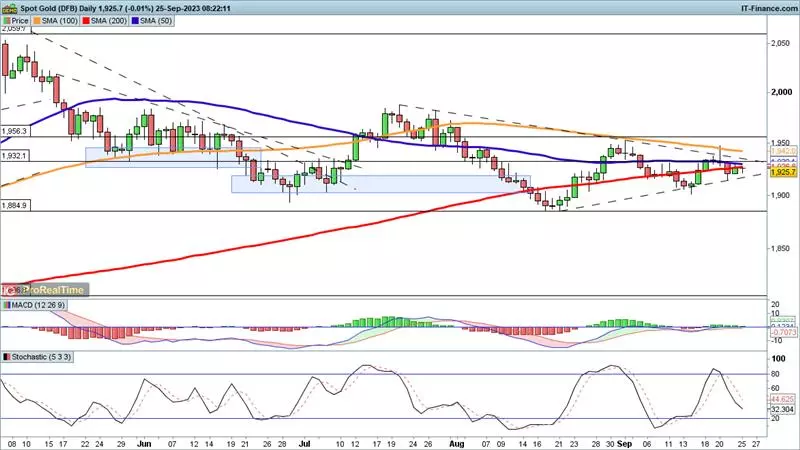
Gold capped below 200-day moving average
Spot Gold prices recovered on Friday, though they were unable to break above the 200-day simple moving average.
Early trading on Monday has seen the price push higher, challenging the 200-day simple moving average again. A close above this and the 50-day simple moving average would then see the price challenge trendline resistance from the July highs. A breakout above this and above $1950 would mark a bullish development, at least in the short-term.
Meanwhile, a failure to clear $1930 would then see the price test trendline support from the August lows ($1885). A close below $1915 would then open the way to $1900 and $1885.
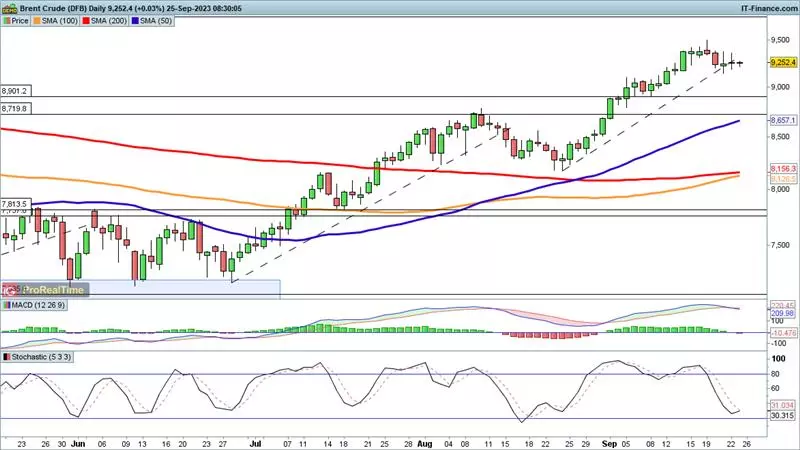
Brent steady despite trendline break
The price drifted through trendline support last week, but as yet it has not seen much momentum to the downside.
Initial losses might first target $90, and then down to the December 2022 and January 2023 highs around $89 as possible support. For the moment however, the buyers have held the price around current levels.
A resumption of the move higher would see the price target $94 and $95, before beginning a move in the direction of the October and November 2022 highs at $98 and higher.
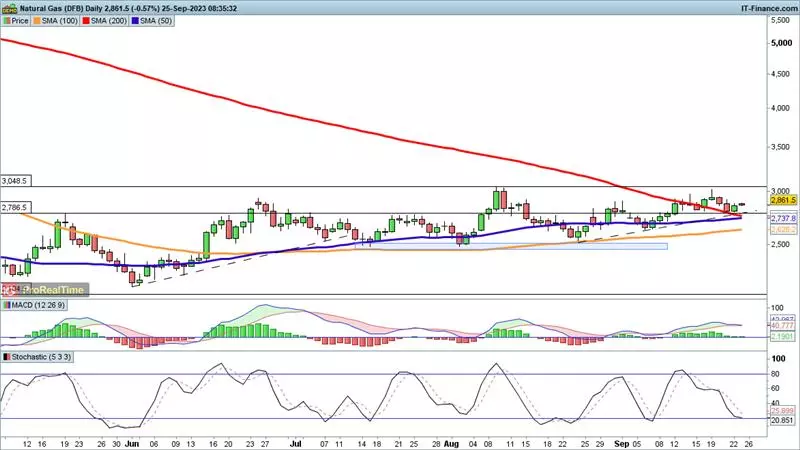
Natural Gas rallies
Steady gains from the August low have seen the price break back above the 200-day simple moving average.
While last week saw the price fall back from the September high around 3000, the price then found support around the 200-day simple moving average. Additional gains target 3000 again, and then to the August high at 3050.
A close back below 2750 would see the price back below the 200-day simple moving average and below trendline support from the August low, potentially reigniting a bearish short-term view.
This information has been prepared by IG, a trading name of IG Australia Pty Ltd. In addition to the disclaimer below, the material on this page does not contain a record of our trading prices, or an offer of, or solicitation for, a transaction in any financial instrument. IG accepts no responsibility for any use that may be made of these comments and for any consequences that result. No representation or warranty is given as to the accuracy or completeness of this information. Consequently any person acting on it does so entirely at their own risk. Any research provided does not have regard to the specific investment objectives, financial situation and needs of any specific person who may receive it. It has not been prepared in accordance with legal requirements designed to promote the independence of investment research and as such is considered to be a marketing communication. Although we are not specifically constrained from dealing ahead of our recommendations we do not seek to take advantage of them before they are provided to our clients.

Start trading forex today
Trade the largest and most volatile financial market in the world.
- Spreads start at just 0.6 points on EUR/USD
- Analyse market movements with our essential selection of charts
- Speculate from a range of platforms, including on mobile
Live prices on most popular markets
- Forex
- Shares
- Indices