English
Ahead of the game: 9 June 2025
The Australia 200 extended its winning streak as soft GDP data strengthened expectations of more Reserve Bank of Australia cuts. Global markets gained on easing inflation and dovish signals from central banks.


Australia 200 gains on Wall Street strength and weak GDP
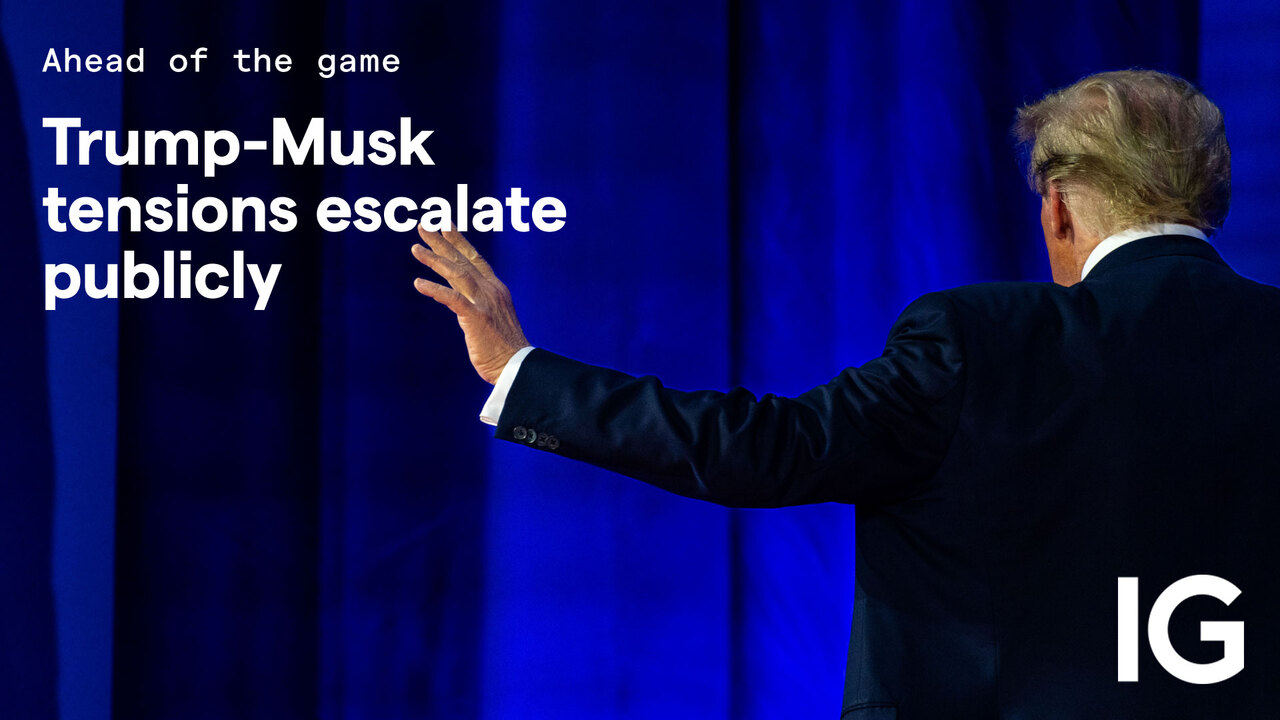
United States (US) stock markets gained this week as investors navigated trade tensions, mixed economic data, and the public fallout between Tesla chief executive officer (CEO) Elon Musk and US President Donald Trump.
Locally, the Australia 200 (ASX 200) recorded its seventh week of gains in the past eight. This week's rally was supported by tailwinds from Wall Street and a disappointing first-quarter (Q1) 2025 Australian gross domestic product (GDP) reading, which bolstered expectations of additional Reserve Bank of Australia (RBA) interest rate cuts by year's end. The financial and energy sectors were the strongest performers.
The week that was: highlights
- The Institute for Supply Management (ISM) manufacturing purchasing managers' index (PMI) in the US fell to 48.5 in May, below the expected 49.5
- The ISM services PMI in the US fell to 49.9 in May, below the anticipated 52
- Job Openings and Labor Turnover Survey (JOLTS) job openings in April increased to 7.39 million, surpassing the 7.05 million anticipated
- Automatic Data Processing (ADP) employment growth in May fell to 37,000, compared to the expected 114,000
- US initial jobless claims rose to 247,000 versus the expected 235,000, with the four-week moving average climbing to 235,000
- In the European Union (EU), headline inflation eased to 1.9% year-on-year (YoY) in May from 2.2% prior
- The core measure of inflation in the EU fell to 2.3% from 2.7%, the lowest reading since January 2022
- The European Central Bank (ECB) cut its policy rates by 25 basis points (bp), taking the deposit rate to 2%
- In Japan (JP), headline inflation remained steady at 3.6% in April
- The core measure of inflation in JP accelerated to 3.5% from 3.2%, the highest reading since January 2023
- In China (CN), the Caixin manufacturing PMI fell to 48.3 in May, below the expected 50.7
- The Caixin services PMI in CN rose to 51.1 in May, exceeding the anticipated 50.7
- In Australia (AU), GDP increased by 0.2% in the March quarter of 2025, decelerating from 0.6% in the prior quarter, for an annual growth rate of 1.3%
- Both the quarterly and annual GDP numbers in AU were softer than expected
- Crude oil gained 3.96% this week to $63.20
- Gold rose 2.2% this week to $3361
- Bitcoin fell 3.74% this week to $101,752
- Wall Street's gauge of fear, the volatility index (VIX), fell to 18.47 from 18.57 last week.
Key dates for the week ahead
Australia & New Zealand
- AU: Westpac consumer confidence (Tuesday, 10 June at 10:30am AEST)
- AU: National Australia Bank (NAB) business confidence (Tuesday, 10 June at 11:30am AEST)
- New Zealand (NZ): Business PMI (Friday, 13 June at 8:30am AEST)
China & Japan
- CN: consumer price index (CPI) (Monday, 9 June at 11:30am AEST)
- CN: producer price index (PPI) (Monday, 9 June at 11:30am AEST)
- CN: balance of trade (Monday, 9 June at 1:00pm AEST)
United States
- US: CPI (Wednesday, 11 June at 10:30pm AEST)
- US: PPI (Thursday, 12 June at 10:30pm AEST)
- US: initial jobless claims (Thursday, 12 June at 10:30am AEST)
- US: Michigan consumer sentiment preliminary (Saturday, 14 June at 12:00am AEST)
Europe & United Kingdom
- United Kingdom (UK): unemployment rate (Tuesday, 10 June at 4:00pm AEST)
- UK: GDP (Thursday, 12 June at 4:00pm AEST)
- EU: industrial production (Friday, 13 June at 7:00pm AEST)

Key events for the week ahead
CN: CPI
Date: Monday, 9 June at 11:30am AEST
In April, China's CPI declined 0.1% YoY, marking the third consecutive month of deflation as China confronts weakening domestic consumption and mounting trade uncertainty.
In May, the government implemented a series of monetary easing measures, including reductions in policy rates and reserve requirement ratios. Additionally, US tariffs on Chinese goods were temporarily reduced from 145% to 30%. These policy interventions may alleviate deflationary headwinds facing consumer and production prices.
On the contrary, Caixin's composite PMI released this week dropped sharply from April's 51.1 to 49.6. Which highlights reduced foreign demand and intensified business competition, pressuring output prices downward.
For May the market anticipates the CPI to fall by -0.2% YoY, indicating a need for further measures to boost consumption, particularly in services sector. In addition, allowing the Chinese yuan to fall against the US dollar would ease the deflationary risks to the Chinese economy.
Chinese inflation rate chart

AU: Westpac Consumer Confidence
Date: Tuesday, 10 June at 10:30am AEST
The Westpac-Melbourne Institute consumer sentiment index rose by 2.2% to 92.1 in May 2025 from 90.1 in April, reflecting modest recovery in Australian consumer confidence. This increase followed a significant 6% April decline due to US tariff impact concerns.
The May rebound regained one-third of April's decline, driven by several factors:
- A 7% gain in the 'family finances vs a year ago' sub-index., signalling stronger consumer perceptions of their financial situation
- A 7.4% rally in the Australia 200 between the April and May surveys
- Lower fuel prices and softerinflation expectations, which raised expectations for an RBA cut at its meeting on 20 May.
Despite this uptick, the index remains below the neutral 100 threshold - signalling lingering pessimism. A modest rise to 93.5 is expected in June, reflecting additional gains in the Australia 200 and following the RBA’s 25 bp rate cut in May and the expectation of another RBA rate cut in July or August.
Australian consumer confidence chart

US: CPI
Date: Wednesday, 11 June at 10:30pm AEST
In April, the headline inflation rate rose 0.2% month-on-month (MoM), bringing the annual rate to 2.3% YoY, the lowest since February 2021. Core inflation rose 0.2% MoM, keeping the annual rate at 2.8% YoY, aligning with market forecasts.
This week, Federal Reserve (Fed) speakers (Waller, Bostic and Cook) expressed caution on inflation and potential rate cuts, due to uncertainties surrounding tariffs as well as their potential to drive both inflation and an economic slowdown. Waller emphasised that if tariffs are moderate at around 10%, and underlying inflation continues trending toward the Fed’s 2% target, with a solid labour market, he would support 'good news' rate cuts later this year.
This month, the preliminary expectation is for headline inflation to rise by 0.2% MoM and for the annual rate to rise to 2.5%. The core inflation rate is expected to also rise by 0.2% MoM and for the annual rate to tick higher to 2.9%.
The US rates market is pricing in an 85% chance of a 25 bp Fed rate cut in September, with a cumulative 55 bp of Fed rate cuts expected by year-end.
US inflation rate chart

Important to know
This information has been prepared by IG, a trading name of IG Australia Pty Ltd. In addition to the disclaimer below, the material on this page does not contain a record of our trading prices, or an offer of, or solicitation for, a transaction in any financial instrument. IG accepts no responsibility for any use that may be made of these comments and for any consequences that result. No representation or warranty is given as to the accuracy or completeness of this information. Consequently any person acting on it does so entirely at their own risk. Any research provided does not have regard to the specific investment objectives, financial situation and needs of any specific person who may receive it. It has not been prepared in accordance with legal requirements designed to promote the independence of investment research and as such is considered to be a marketing communication. Although we are not specifically constrained from dealing ahead of our recommendations we do not seek to take advantage of them before they are provided to our clients.
Ready to open an IG account?
Start your trading journey now
Connect with us
Disclaimers
- CFDs are complex instruments and come with a high risk of losing money rapidly due to leverage. You do not own or have any interest in the underlying asset. You should consider whether you understand how CFDs work, and whether you can afford to take the high risk of losing your money. Please consider the Margin Trading Product Disclosure Statement (PDS), Risk Disclosure Notice and Target Market Determination before entering into any CFD transaction with us.
- The value of shares, ETFs and ETCs bought through an IG share trading account can fall as well as rise, which could mean getting back less than you originally put in. Past performance is no guarantee of future results.
- Please ensure you fully understand the risks and take care to manage your exposure.
- The information on this website is prepared without considering your objectives, financial situation or needs. Consequently, you should consider the information in light of your objectives, financial situation and needs.
- This website is operated by IG Australia Pty Ltd. IG Australia Pty Ltd is located on Level 32, Queen & Collins, 376-390 Collins Street, Melbourne, VIC 3000. ABN 93 096 585 410, Australian Financial Services Licence No. 515106. Derivatives Issuer Licence in New Zealand FSP No. 684191, NZBN 9429047618251.