S&P 500 Momentum Report
Dovish rate expectations and hopes for an economic soft landing continue to lead the risk-on environment, as the S&P 500 heads past the 4,600 level of resistance this week to register a new year-to-date high.


All eyes on US CPI and Fed meeting this week to support any follow-through in risk rally
Dovish rate expectations and hopes for an economic soft landing continue to lead the risk-on environment, as the S&P 500 heads past the 4,600 level of resistance this week to register a new year-to-date high. Nevertheless, given that a series of rate cuts priced in 2024 has been one of the major catalyst fuelling the rally, whether the index can sustain recent gains will ultimately depend on any validation from the upcoming US consumer price index (CPI) data, followed by the subsequent Federal Reserve (Fed) meeting.
Barring any significant upside surprise in the US inflation data, further rate hold from the Fed this week is likely a done deal, but the cumulative 100-125 basis point (bp) cuts priced for 2024 may seem overly aggressive for policymakers’ comfort, given that inflation remains above target. That may place the risks of pushback against dovish expectations on the table, although whether markets will eventually buy into the Fed’s guidance remains one to watch given the central bank’s prevailing data-dependent stance.
In terms of market breadth, the percentage of S&P 500 stocks above their 50-day moving averages (MA) may be nearing extreme overbought levels (85% versus previous peaks of 90%-92%), which may call for some near-term cooling in the rally ahead. Past instances where the percentage of S&P 500 stocks above their respective 50-day MA heads above 90%, a near-term retracement in the index tends to follow. Nevertheless, it may have to take much more to reverse the broader upward trend, with any downside potentially a temporary move for an eventual move higher.
Technical analysis: S&P 500 touches new year-to-date high
On the broader scale, a bullish flag formation seems to be intact since October 2022, with an upward break of the flag channel pattern in mid-November this year reinforcing a continuation of the bullish trend. That said, the declining Moving Average Convergence/Divergence (MACD) amid the index pushing to higher highs do suggest some easing upward momentum, which may raise the odds of a retracement. Nevertheless, the broader trend remains up, with the index trading above its Ichimoku cloud zone on the daily chart, alongside various upward-sloping MA (50-day, 100-day, 200-day).
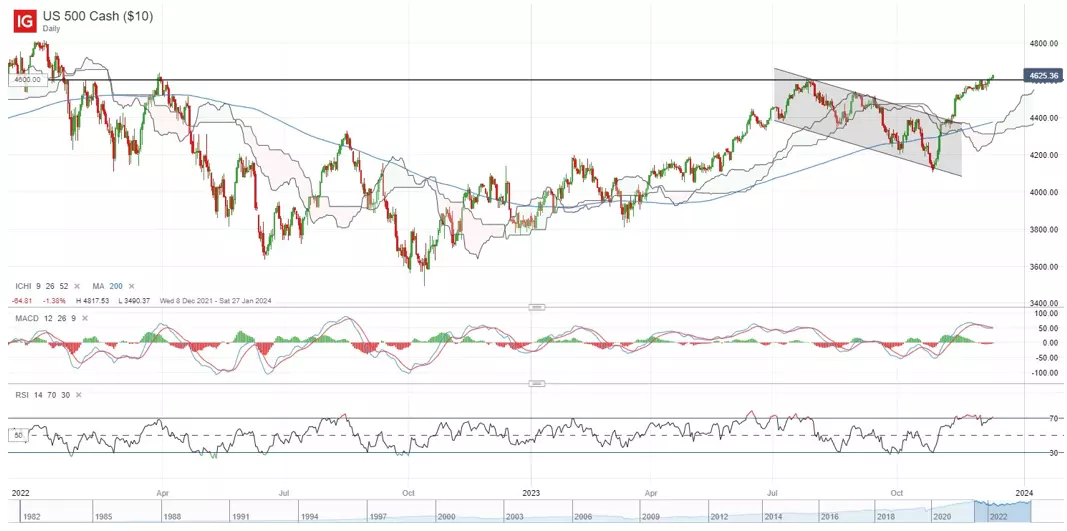
Source: IG charts
Sector performance
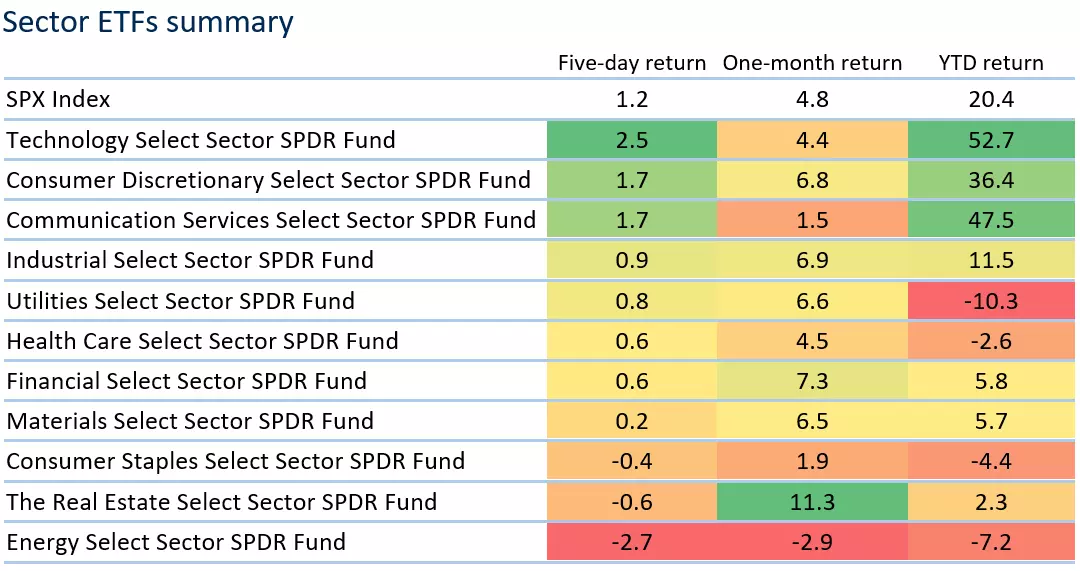
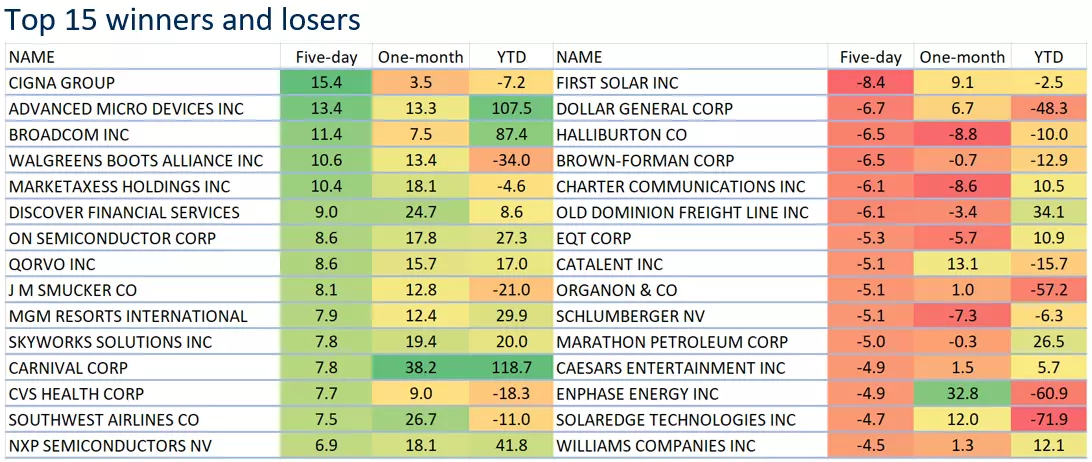
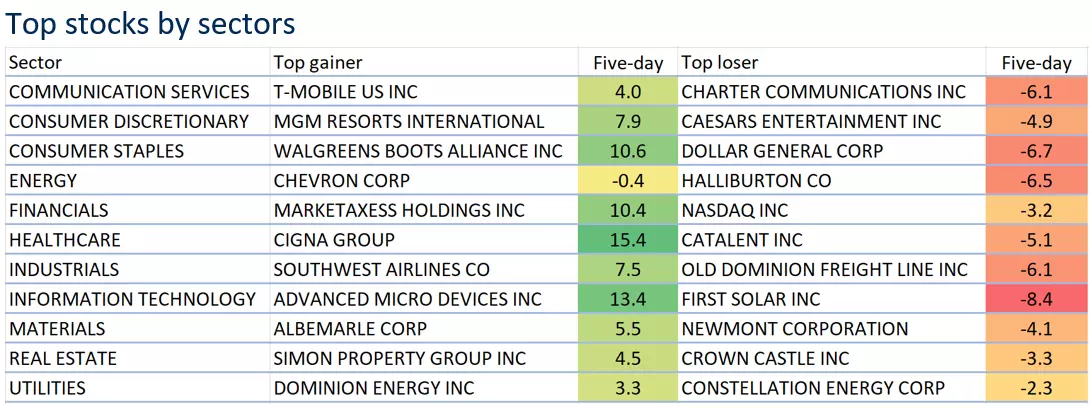
Dovish Fed rhetoric continued to work its way into the risk environment last week, with greater outperformance in rate-sensitive growth sectors while eight out of 11 S&P 500 sectors were in positive territory. The ‘Magnificent Seven’ stocks were all higher for the week, with more notable showing from Alphabet (+3.1%), Nvidia (+2.5%) and Apple (+2.0%). Semiconductor stocks had a banner week as the artificial intelligence (AI) hype resumes – this time with optimism around AMD’s latest AI chip launch. The PHLX Semiconductor Sector was up 6.7% for the week, driving much of the outperformance in the technology sector (+4.4%). Google has gained much traction with the launch of its AI model, Gemini, as well. On the other end of the table, the energy sector is the top underperformer, as oil prices touched its lowest level since July 2023. Year-to-date, defensive sectors, alongside energy, were the only sectors registering losses, which reflects the strong appetite among market participants for higher-risk positioning on prevailing soft landing hopes.
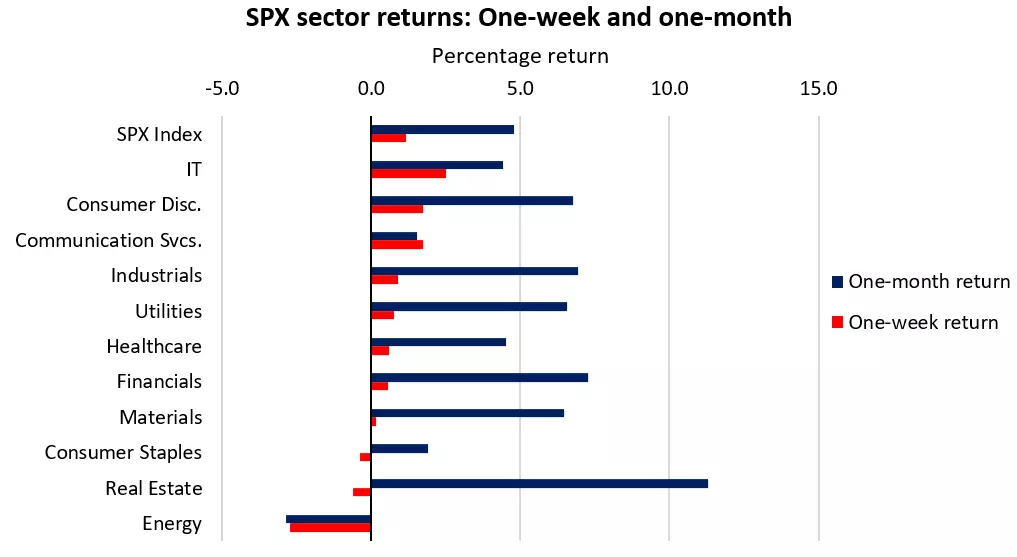
Source: Refinitiv
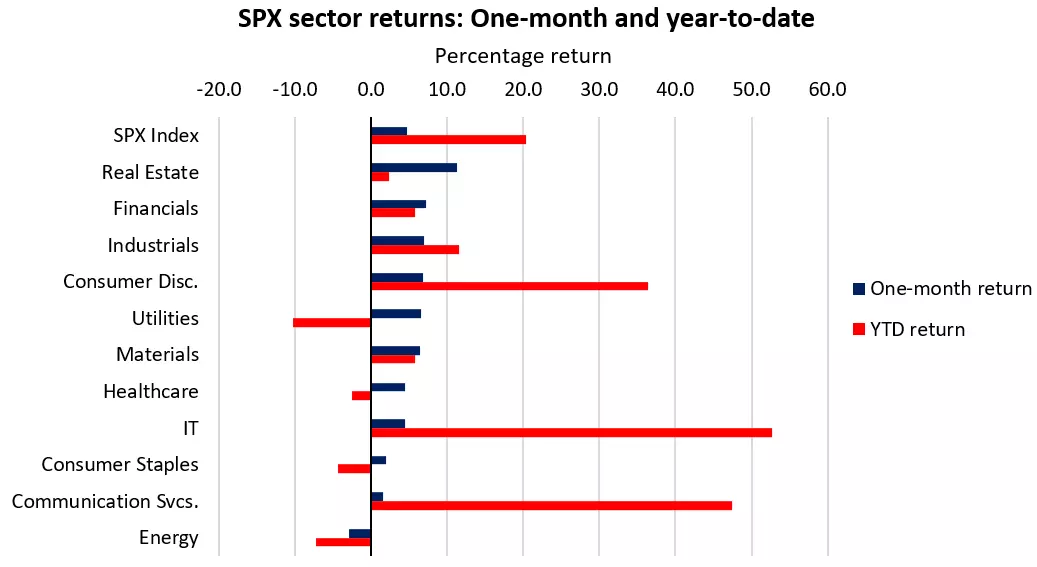
Source: Refinitiv
Source: Refinitiv
*Note: The data is from 5th – 11th December 2023.
Source: Refinitiv
*Note: The data is from 5th – 11th December 2023.
Source: Refinitiv
*Note: The data is from 5th – 11th December 2023.
This information has been prepared by IG, a trading name of IG Australia Pty Ltd. In addition to the disclaimer below, the material on this page does not contain a record of our trading prices, or an offer of, or solicitation for, a transaction in any financial instrument. IG accepts no responsibility for any use that may be made of these comments and for any consequences that result. No representation or warranty is given as to the accuracy or completeness of this information. Consequently any person acting on it does so entirely at their own risk. Any research provided does not have regard to the specific investment objectives, financial situation and needs of any specific person who may receive it. It has not been prepared in accordance with legal requirements designed to promote the independence of investment research and as such is considered to be a marketing communication. Although we are not specifically constrained from dealing ahead of our recommendations we do not seek to take advantage of them before they are provided to our clients.

Seize a share opportunity today
Go long or short on thousands of international stocks.
- Increase your market exposure with leverage
- Get commission from just 0.08% on major global shares
- Trade CFDs straight into order books with direct market access
Live prices on most popular markets
- Forex
- Shares
- Indices