Support and resistance levels explained
Support and resistance levels can help traders gain extra insight into the strength of a price trend. Here we define support and resistance levels, explain how to identify and draw both lines, and more.

What is support and resistance?
‘Support’ and ‘resistance’ are terms for two respective levels on a price chart that appear to limit the market’s range of movement. The support level is where the price regularly stops falling and bounces back up, while the resistance level is where the price normally stops rising and dips back down. The levels exist as a product of supply and demand – if there are more buyers than sellers, the price could rise, and if there are more sellers than buyers, the price tends to fall.
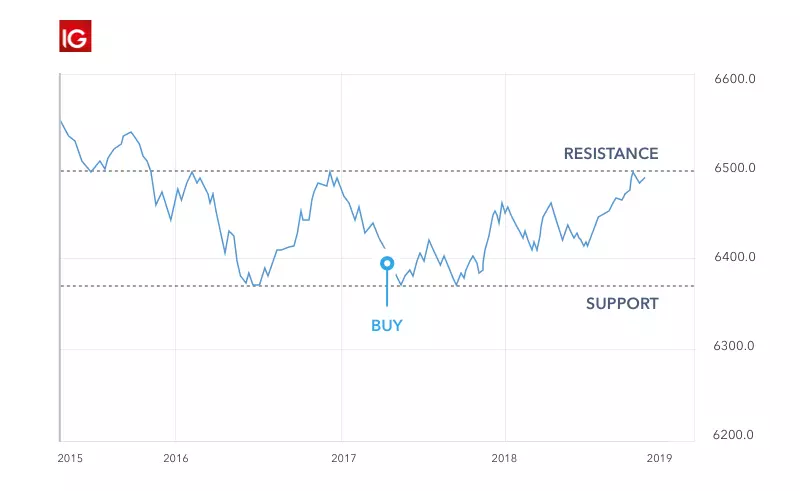
The more often a price hits either level, the more reliable that level is likely to be in predicting future price movements. It often happens that both levels become psychological barriers for traders, as they tend to buy or sell once a level is reached. This only strengthens the result.
If a price touches or breaks through a support or resistance level but jumps back fairly quickly, it is only testing that level. But if a price breaks through any given level for a longer period of time, it is likely to keep rising or falling until a new support or resistance level is established.
How to identify support and resistance level
There are a few ways to identify support and resistance levels. It’s quite easy to spot these levels, but they can be very useful in helping you choose the best time to enter a market, as well as where to put your stops and limits. To identify support and resistance levels, traders can look at:
1. Historical price data
The most reliable source for identifying support and resistance levels is historical prices, making them invaluable to traders. The key is to familiarise yourself with past patterns – sometimes from very recent activity – so you can recognise them if they appear again. However, it is important to remember that past patterns may have formed under different circumstances, so they are not always a reliable indicator.
2. Previous support and resistance levels
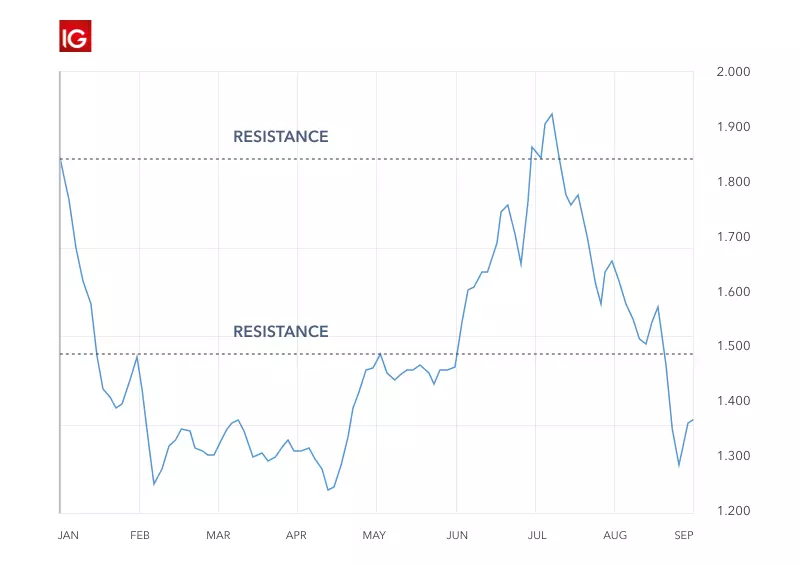
You can use previous notable support or resistance levels as markers for possible entry and exit points, as well as indicators of future movement. It's important to note that major support and resistance levels are rarely exact figures. It's unusual for a market to hit exactly the same price time after time before reversing, so it's probably more useful to think of them as support or resistance zones.
3. Technical indicators
Technical indicators or trendlines – such as the ones covered later in this article – can provide dynamic support or resistance levels that move as the chart progresses. Support and resistance levels for different markets will often be based on different factors, so developing the ability to recognise which levels are going to impact a market’s price can take time. For that reason, it is important to practise identifying support or resistance levels using historical charts.
How to draw support and resistance lines
To draw support and resistance lines on a chart, you first have to find them by using one of the following methods:
- Peaks and troughs
- Support and resistance levels from a previous timeframe
- Moving averages
- Trend lines
These are covered in detail in the sections that follow. To establish the strength of the support and resistance lines, you can combine these methods.
Peaks and troughs
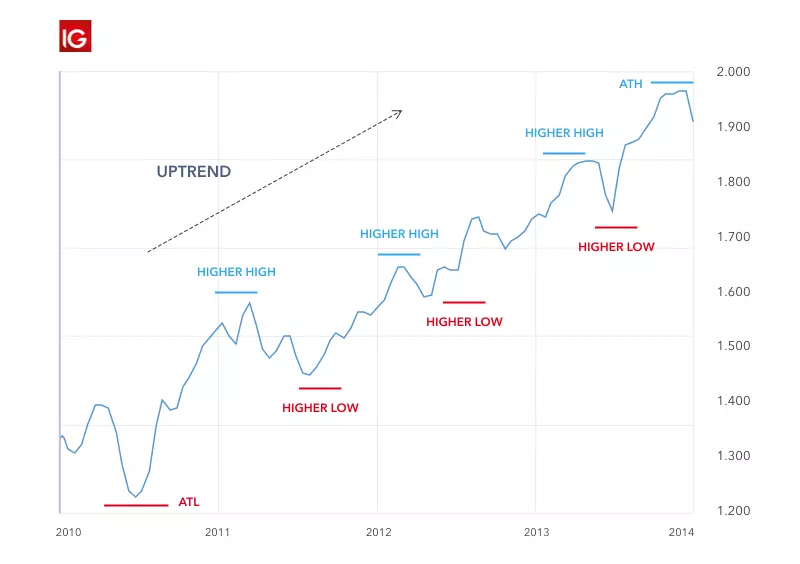
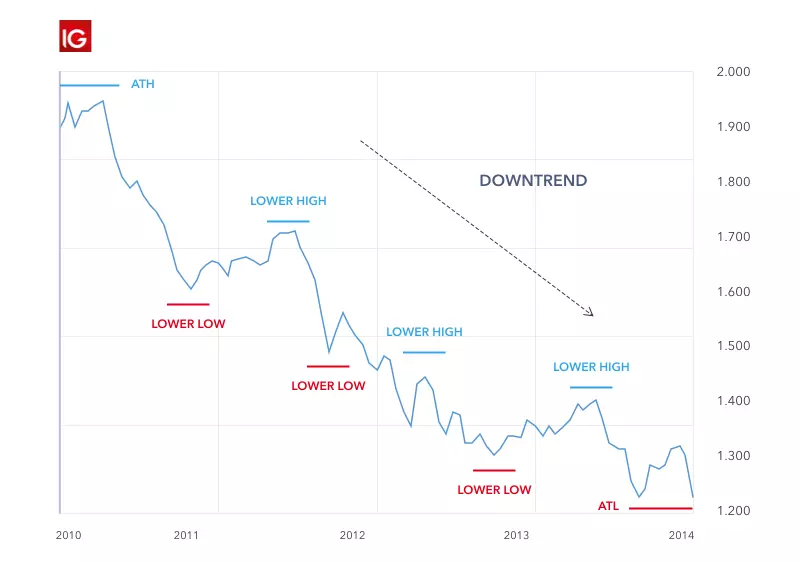
To draw your lines using peaks and troughs, select your timeframe, then identify the highest peak on the chart and do the same with the lowest point. Mark each peak and trough. If there is a downtrend, the support level will be the lower-low peak and the resistance level will be the lower-high peak. Conversely, if there is an upward trend the support level will be the higher-low peak and the resistance level will be the higher-high peak.
Previous timeframes
If you’re using support and resistance levels from a previous timeframe, choose a short timeframe, for example 15 minutes. Then, draw the levels from the one-hour and four-hour time frames on the 15-minute frame. If the levels from the longer time frames are very similar or equal to the levels from the shorter time frame, these could be considered strong levels of support and resistance.
Moving averages
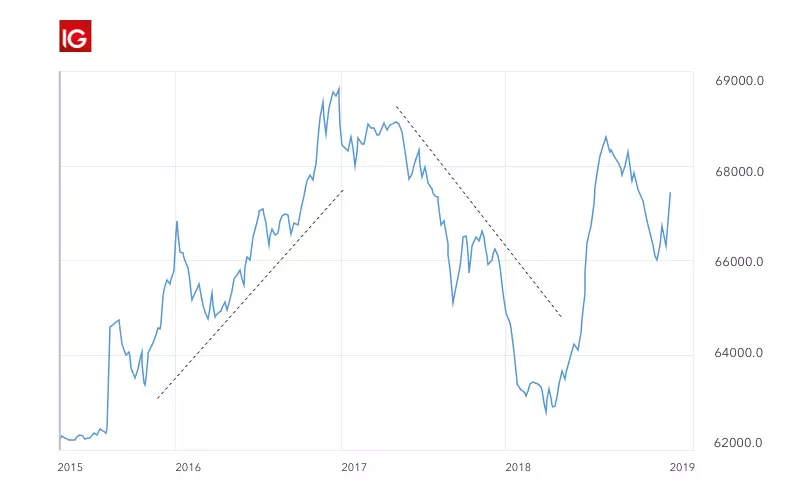
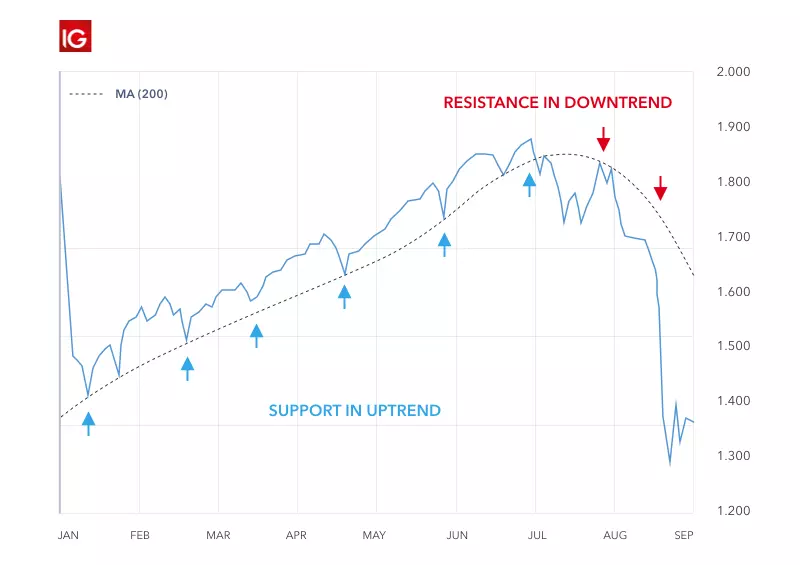
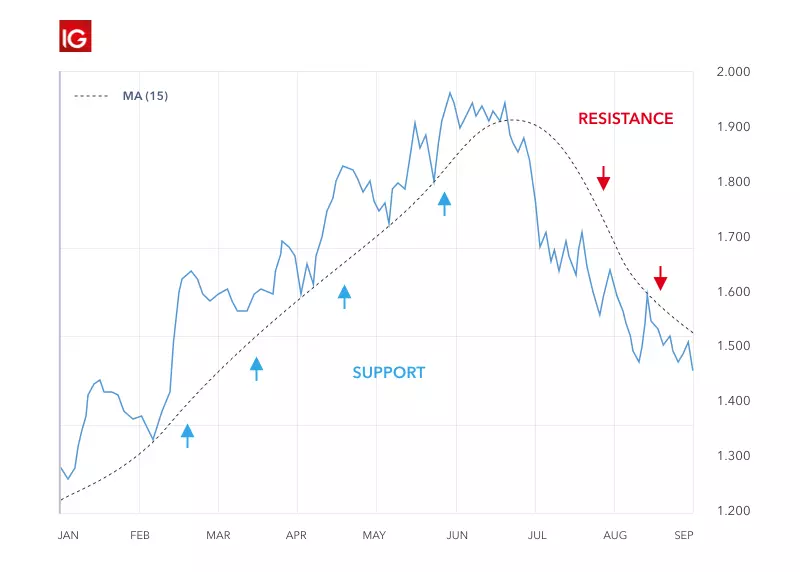
The moving average indicator is another way to identify support and resistance levels, and draw them on a chart. With the indicator enabled, draw a diagonal line from the highest peak to the lowest peak to see which way the trend is moving. If the trendline moves up, this moving average line will act as a level of support and vice versa. This is called dynamic support or resistance, because the levels are constantly changing.
Trend lines
If you are using trend lines, make sure you have at least three peaks or three troughs before you draw your lines, so that you have a useable trend line. Then, once you've plotted the trendlines onto your chart, your uptrend line will be the support level, while the donwtrend line will be the resistance level. As with moving average support and resistance levels, these levels are dynamic.
It is important to combine one or more of the above methods to establish the most accurate support and resistance levels.
Support and resistance trading strategy
Using support and resistance levels as a trading strategy is one of the very basic methods of trading. It can be used to manage risk and place stops, determine the market conditions, and find appropriate entry and exit positions. The most common trading strategy using support and resistance levels is buying (going long) when the price is closing in on the support level and selling (going short) when the price is moving closer to the resistance level. However, traders should wait for some confirmation that the market is still following the trend.
Placing stops and limits below support and above resistance is also recommended. It helps traders to close a position quickly if the price breaks through levels of support or resistance. Before you place the trade, consider your profit target and what you consider to be an acceptable level of loss, then decide on your exit points near the support and resistance levels.
Another strategy used in support and resistance trading is the breakout strategy, whereby traders wait for the stock price to move outside either level. A breakout is not just a slight movement beyond the support or resistance levels. It is defined by particularly sudden and rapid movement with increased momentum, which creates opportunities for profit.
This information has been prepared by IG, a trading name of IG Australia Pty Ltd. In addition to the disclaimer below, the material on this page does not contain a record of our trading prices, or an offer of, or solicitation for, a transaction in any financial instrument. IG accepts no responsibility for any use that may be made of these comments and for any consequences that result. No representation or warranty is given as to the accuracy or completeness of this information. Consequently any person acting on it does so entirely at their own risk. Any research provided does not have regard to the specific investment objectives, financial situation and needs of any specific person who may receive it. It has not been prepared in accordance with legal requirements designed to promote the independence of investment research and as such is considered to be a marketing communication. Although we are not specifically constrained from dealing ahead of our recommendations we do not seek to take advantage of them before they are provided to our clients.

Explore the markets with our free course
Discover the range of markets and learn how they work - with IG Academy's online course.