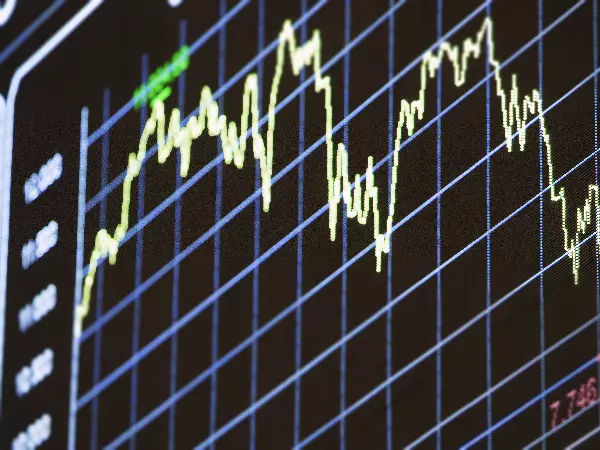
What is stock market volatility?
Volatility is the frequency and size of a market move in a certain time. Higher volatility can be a sign of risk and fear in markets, but it produces more trading opportunities. Learn about market volatility and how to trade.

What's on this page?
Stock market volatility definition
Stock market volatility refers to the frequency and size of a market move in an upward or downward direction over a specified period. The larger and more frequent the price move, the higher the volatility. In statistical terms, volatility is the standard deviation of a market's annualised returns over a given period.
When volatility is at a heightened level, it is usually considered to be a sign of increased risk and fear in the market. Volatility is a key input into calculating option prices.
How is market volatility measured?
Standard deviation is by far the most popular measure used by traders to measure volatility. Standard deviation is a way of measuring the size of price moves to try to help determine whether the price will become more or less volatile in the future. The standard deviation of a security is calculated by taking the square root of the variance. Variance measures the dispersion of returns around the mean price of a security.
You can calculate the standard deviation on our platform. Most traders would use a computer program to calculate the standard deviation as its faster and more accurate but you can calculate it by hand by following the steps below:
[insert image of formula]
- Calculate the mean average of the security's historic prices in the defined time period.
- Work out the deviation by calculating the difference between the mean average and each of the prices, then square each of those numbers.
- Add each of these squared numbers together and divide it by the number of prices in the data set. This is known as the variance.
- The standard deviation is the square root of the variance, calculated in step 3 above.¹
Chartists use Bollinger Bands to analyse standard deviation over time. Bollinger Bands consist of a moving average, an upper band and a lower band. The two bands determine whether the prices are high or low on a relative basis. When Bollinger Bands are narrow, it suggests the market has been in a sideways or consolidation pattern. When Bollinger Bands widen, it suggests an increase in volatility. As volatility is considered to be cyclical in nature; after a period of low volatility, you can expect to see a period of high volatility. You can combine price breakout levels with Bollinger Bands to trade a volatility breakout strategy.
You can also measure volatility using beta. Beta determines a security's volatility relative to the overall market. Beta can be calculated using regression analysis.
Types of volatility
Implied volatility
Implied volatility is a forward-looking measure that enables traders to determine how volatile a security or market is expected to be in the future. The concept gives traders a way to calculate the probability of future volatility. It is measured as a percentage and has a tendency to increase when prices decline. High implied volatility suggests that large price swings may occur.
Beta
Beta measures a stock's volatility of returns relative to the overall market, usually against its relevant benchmark. If the S&P 500 Index has a beta of 1.0, a constituent stock with a beta greater than 1.0 indicates that the frequency and size of the stock's movement is higher than that of the index. Conversely, a stock with beta that's less than 1.0 will move less than the index.
The VIX
The Volatility Index, created by the Chicago Board Options Exchange (CBOE), is a popular measure of implied volatility and is known as the 'fear gauge'. The VIX measures the expected volatility of the S&P 500 for the following 30 days. It's derived from real-time pricing on the S&P 500 call and put options over a wide range of strike prices. An increase in implied volatility, or a high VIX reading, suggests a more risky or uncertain market and a potential downward move in the S&P 500 Index.
Volatility as an intrinsic feature of financial markets
Periods of high volatility are a normal feature in financial markets and should be expected. Volatility can be caused by a number of factors. Geopolitical and macroeconomic events can impact the whole market, while certain incidents may only impact a particular industry, sector or company. Markets are usually fairly calm, with brief periods of above-average volatility.
Although increased volatility can be unnerving for investors, many traders embrace high volatility in markets because it provides more trading opportunities. Traders can limit their potential losses using risk management techniques efficiently. Longer-term investors should have a plan in place in the event of increased volatility. Market sell-offs, for example, are often considered to be good long-term buying opportunities – if more investors sell their holdings than new investors buy in, the share will fall in price.
A great example of a buying opportunity at a time of increased volatility and market weakness came in March 2020 during the COVID-19 pandemic. The S&P 500 fell sharply from nearly 3,400 to below 2,300 at the peak of the pandemic panic, and the VIX exploded higher – from around 15 to 85. However, after the Federal Reserve and the other major central banks took the decision to support their economies with aggressive quantitative easing, the S&P 500 rallied nearly 73% to close at 3,972 by the end of March 2021. The VIX, meanwhile, fell back to around 20.
How to handle market volatility
Buying quality companies at a cheaper price can be a successful investment strategy, as stocks tend to rise over the long term. For long-term investors with cash on the sidelines, market corrections may offer attractive buying opportunities to invest that cash into stocks.
It is important to have an appropriate emergency fund equal to about three to six months of living expenses so you will not be forced to sell investments in times of market weakness.
You can use the volatility indicators on our platform to help identify when market volatility may be set to increase. These include Bollinger Bands, the Average True Range Indicator, the VIX, the Keitner Channel Indicator, the Donchian Channel Indicator, the Chaikin Volatility Indicator, the Twiggs Volatility Indicator and the Relative Volatility Index.
Traders use breakout strategies and scalping (entering buy and sell orders over the short term) during periods of increased market volatility. They can also buy the VIX Index or options to take advantage of the anticipated increase in volatility or to hedge their long positions.
How to trade on market volatility
- Do your research about the different markets
- Decide whether you prefer to trade market volatility using a spread betting or CFD trading account
- Open a trading account or practise with a free demo account
- Choose the market, position size and whether to go long or short
- Manage your risk and place your trade
Research your market
In the UK, you can choose from a huge number of markets to trade on via our award-winning platform. These include forex, stock indices and commodities.
Learn about the differences between spread betting and CFD trading
Trading via spread bets and CFDs
You can choose a certain amount per point movement using spread bets. This gives you more control over your position size and currency exposure. Spread bets are popular because all your profits are tax-free, and there is no stamp duty or commission payable.*
All spread bets are leveraged.
A contract for difference (CFD) is a leveraged derivative similar to a spread bet. It means you don't own the underlying asset, but you're speculating on its price movement. Your currency exposure and initial margin will vary according to the market price of the asset chosen.
Your wins or losses will depend on the outcome of your prediction. CFDs are popular with traders because you can offset losses on CFDs against profits for capital gains tax purposes.* Therefore, traders often use CFDs to hedge their positions.
Remember, trading with spread betting or CFDs comes with added risk attached to leverage. Your position will be opened at a fraction of the value of the total position size – but you can gain or lose money much faster than you might expect. Your losses can exceed the initial margin that you paid because potential profits and possible losses are magnified to the full value of the trade.
* Tax laws are subject to change and depend on individual circumstances. Tax law may differ in a jurisdiction other than the UK.
How to invest in shares at times of market volatility
- Do your research and learn about stocks, shares and equities
- Create a share dealing account to invest in shares
- Choose whether you would like to open a Smart Portfolio with us or a share dealing account
- Deposit funds into your chosen account
- Pick your stock, ETF or investment trust, as well as how much you would like to invest
- If you've chosen one of our Smart Portfolios, we'll ask you some questions about your risk profile and investment objectives
Learn about the differences between trading and investing
When you invest in shares, you are taking direct ownership in the company. This is suitable for long-term investing, as you may expect that the shares will increase in value over time. You can choose to invest in shares and ETFs as part of your long-term investment strategy.
If you would like to invest long-term but prefer to take a less active approach in the decision-making process, you can open a Smart Portfolio with us. These are low-cost portfolios managed by experts. Your investments will be spread across shares, bonds and commodities to suit your needs and risk profile.
When share dealing, you buy and own the shares, so you aren't exposed to the risk involved with CFDs. Still, it's good to remember that past performance doesn't guarantee future returns.
Stock market volatility summed up
- Stock market volatility refers to the frequency and size of a market move in an upward or downward direction over a specified period
- A higher VIX reading or implied volatility indicates increased fear and uncertainty in the market
- Volatility is an intrinsic feature of financial markets, and periods of higher volatility should be expected
- You can use breakout strategies and scalping to make profitable trades at times of increased market volatility
This information has been prepared by IG, a trading name of IG Markets Limited. In addition to the disclaimer below, the material on this page does not contain a record of our trading prices, or an offer of, or solicitation for, a transaction in any financial instrument. IG accepts no responsibility for any use that may be made of these comments and for any consequences that result. No representation or warranty is given as to the accuracy or completeness of this information. Consequently any person acting on it does so entirely at their own risk. Any research provided does not have regard to the specific investment objectives, financial situation and needs of any specific person who may receive it. It has not been prepared in accordance with legal requirements designed to promote the independence of investment research and as such is considered to be a marketing communication. Although we are not specifically constrained from dealing ahead of our recommendations we do not seek to take advantage of them before they are provided to our clients. See full non-independent research disclaimer and quarterly summary.

Discover how to trade the markets
Explore the range of markets you can trade – and learn how they work – with IG Academy's free ’introducing the financial markets’ course.