What is risk and reward for traders and investors and why does it matter?
Every trade or investment has an inherent level of risk and reward attached to it. Explore the risk-reward ratio and other factors that could influence the outcome of your trade.
Call 0800 195 3100 or email newaccounts.uk@ig.com to talk about opening an account.

Why are risk and reward important?
Risk and reward are important because they’re the two key factors that inform any trade or investment decision. The risk is the possible downside of the position, while the reward is what you stand to gain.
In financial markets, risk and reward are inseparable, as they form a trade-off pair – ie the more risk you’re willing to take on, the higher the potential reward or loss could be. On the other hand, the less risk you accept, the lower your potential rewards.

Risk-reward profiles
There are three types of trader risk-reward profiles:
1. Risk averse
The objective of any investment or trade for the risk averse is to maximise the potential upside while simultaneously minimising potential downside. For example, given two equal rates of return, you’d opt for the investment with a lower level of risk.
Both assets in the example below have an expected return of 10%, so ‘asset 1’ would be preferred, as each unit of return carries lower risk. It’s worth noting that rates of return aren't guaranteed in any investment.
| Expected return | Risk* | |
| Asset 1 | 10% | 2% |
| Asset 2 | 10% | 5% |
*Measured as standard deviation (SD)
Likewise, for two equal risk levels, you’d choose the opportunity with the higher rate of return (RoR).
Here, you’d prefer ‘asset 2’ because your level of risk is buying you a higher potential return.
| Expected return | Risk* | |
| Asset 1 | 5% | 5% |
| Asset 2 | 10% | 5% |
*Measured as standard deviation (SD)
2. Risk neutral
If you fit this profile, you’re focused on obtaining the highest level of expected returns regardless of the accompanying risk. In other words, you’re indifferent to the risk – you just focus on the possible gain.
3. Risk seeking
Risk seekers actively seek out opportunities that are high risk. Although this means that the probability of loss increases, the potential upside is high, too. An example of this would be cryptocurrency trading, as the market is extremely volatile.
To practise trading in a risk-free environment, open a demo account.
What is ‘risk’ in financial markets?
Risk in financial markets is seen as a measure of the uncertainty relating to the outcome of your trade or investment. This uncertainty exists because there’s no guarantee that markets will behave in the way you expect.
Further, when uncertainty about the future value of an asset increases, the potential for monetary losses also increases. In other words, more uncertainty equals more risk. To compensate for the higher probability of loss, you’d want a more favourable expected RoR on your initial outlay.

What is ‘reward’ in financial markets?
Reward in financial markets is what you make from a trade or investment, eg possible profit. It can be defined as a benchmark RoR that has a reasonable possibility of materialising.
It’s usually referred to as the ‘expected return’, and how it’s derived depends on the risk-reward analysis you’re using. If you’re relying on historical data, for example, a common way of establishing the expected rate of return is to find an average RoR over a period. Note that historic returns are no guarantee of future outcomes.
Period of time (eg. years) |
Historical rate of return |
Mean rate of return, periods 1 to 5 |
|||
1 |
7.5% |
|
|||
| 2 | 4% | ||||
| 3 | -2% | ||||
| 4 | 9% | ||||
| 5 | 8% | ||||
| Mean rate of return = 5.3% | |||||
Analysts may favour forward-looking projections rather than expecting past data to correctly predict future performance. In this case, they’d establish a set of potential returns and weight them by the probability of each return being realised. An average of these probability-weighted returns would then produce an expected return value.
Probability [P] |
Possible returns [R] |
P x R |
Expected returns (E[R]) |
0.25 |
4% | (0.25 x 4%) = 1% | 1% + 3.5% + 3% = 7.5% |
0.5 |
7% | (0.5 x 7%) = 3.5% | |
0.25 |
12% | (0.25 x 12%) = 3% | |
| Expected rate of return = 7.5% | |||
What is the risk-reward ratio?
The risk-reward ratio (R/R ratio) is a way of assessing the expected return on a trade per unit of risk. As a trader or investor, you’d typically use the monetary amount you stand to lose as the risk input, and your expected profit as the reward. So, if you risk £100 and expect to make £300, your R/R ratio will be 1:3, or 0.33.
Let’s look at a trading example. Say you expect a company’s shares to increase in value from £130 to £200 due to a positive earnings report. You decide to buy 10 shares at £130 and set a stop-loss order to automatically close your trade if the price drops to £110.
Because the stop-loss caps your risk, the maximum amount you stand to lose is (£130 - £110) x 10 = £200.
Your expected return is (£200 - £130) x 10 = £700. Your R/R ratio is 1:3.5, or 0.29.
In cases where your R/R ratio is greater than 1, each unit of risked capital is potentially earning you less than one unit of an anticipated reward. Equally, when the R/R ratio is less than 1, each unit of risked capital is potentially earning you more than one unit of anticipated reward.
So the general rule is a risk-to-reward ratio of over 1.0 means the possible risk is greater than the possible reward, and anything below 1.0 means the possible profits are greater than the potential risk.
Bear in mind that the R/R ratio is just a tool to help you understand the risk-reward trade-off and is by no means a watertight guide.
If your reward is very high compared to your risk, the chances of a successful outcome may decrease due to the effects of leverage. This is because leverage magnifies your exposure, and amplifies profits and losses. Therefore, risk management is critically important.
How is risk measured?
Risk is measured using different methods and models. These often involve analysing deviations in historical data and calculating future price probability. Popular risk measurement methods and models include:
- The risk/reward ratio
- Variance and SD in historical data
- Probable future variance and SD
- Value-at-Risk (VaR) models
- Beta
Note that, although these are used widely, none are guaranteed to accurately represent actual risk levels.
You should always employ a solid risk management strategy.
Variance and standard deviation (SD)
Variance and standard deviation (SD) models assess the volatility of a rate of return (RoR). The more often a return is found near a mean (expected return), the less its variance.
The greater the dispersion of a return, and the further away from the mean this dispersion is, the greater the variance. Because a larger variance results in more uncertainty about future results, risk increases.

Standard deviation is simply the square root of the variance. It’s favoured because it’s a smaller, more manageable number to work with, and because it’s expressed in the same unit as the object being analysed. For example, if you’re studying the RoR on a stock, the SD will also be expressed as a percentage. The larger the SD, the greater the variance in the RoR, and the higher the asset’s risk.
For ‘normal’ distributions, 68% of returns will fall within one standard deviation above and below the mean. Further, 95% of the return rates will fall within two SDs, and 99.7% will occur within three SDs.
The important take-away is this: the smaller or narrower the SD, the more certainty you have about your probable range of returns, and the less risk you carry.

Value at Risk (VaR)
Value at Risk (VaR) is a way of quantifying risk by using statistical modelling to determine three things: the amount of potential loss, the probability of the loss occurring, and the time period over which the loss could occur in normal market conditions.
For instance, a portfolio of stocks may have a one-day 95% VaR of £100,000. This means that there’s a 5% probability that the portfolio will decrease in value by £100,000 – or more – over the duration of one day. Another way of looking at it is that you should expect the portfolio to drop by at least the above amount (£100,000) one in every 20 days (ie 5% of the time).
The above example can also be written as a 5% one-day VaR of £100,000, depending on the convention used. Alternatively, this is also a one-day VaR equal to £100,000 at 5%. The meaning, however, remains the same. Additionally, the value at risk is frequently expressed as a percentage rather than a nominal value.
Beta
Beta is the degree to which the return of a particular stock varies in line with changes in the overall RoR across all stocks in a market. The ‘market return’ is often established by changes in the level of a comprehensive stock market index like the FTSE All-Share Index, the NYSE Composite, or the S&P 500.
If the market return increases by 1% and a particular stock rises by 0.5% consistently, it’s beta will be 0.5.
If, given the same rise in the market return, the stock dropped by 0.85% on a continual basis, its beta would equal -0.85. Stocks that have a low beta lessen the overall risk of a stock portfolio, while those with a high beta increase it.
Risk and leverage
Before placing any trade, you need to have a clear understanding of how leverage works and how it’ll impact the outcome of your trade.
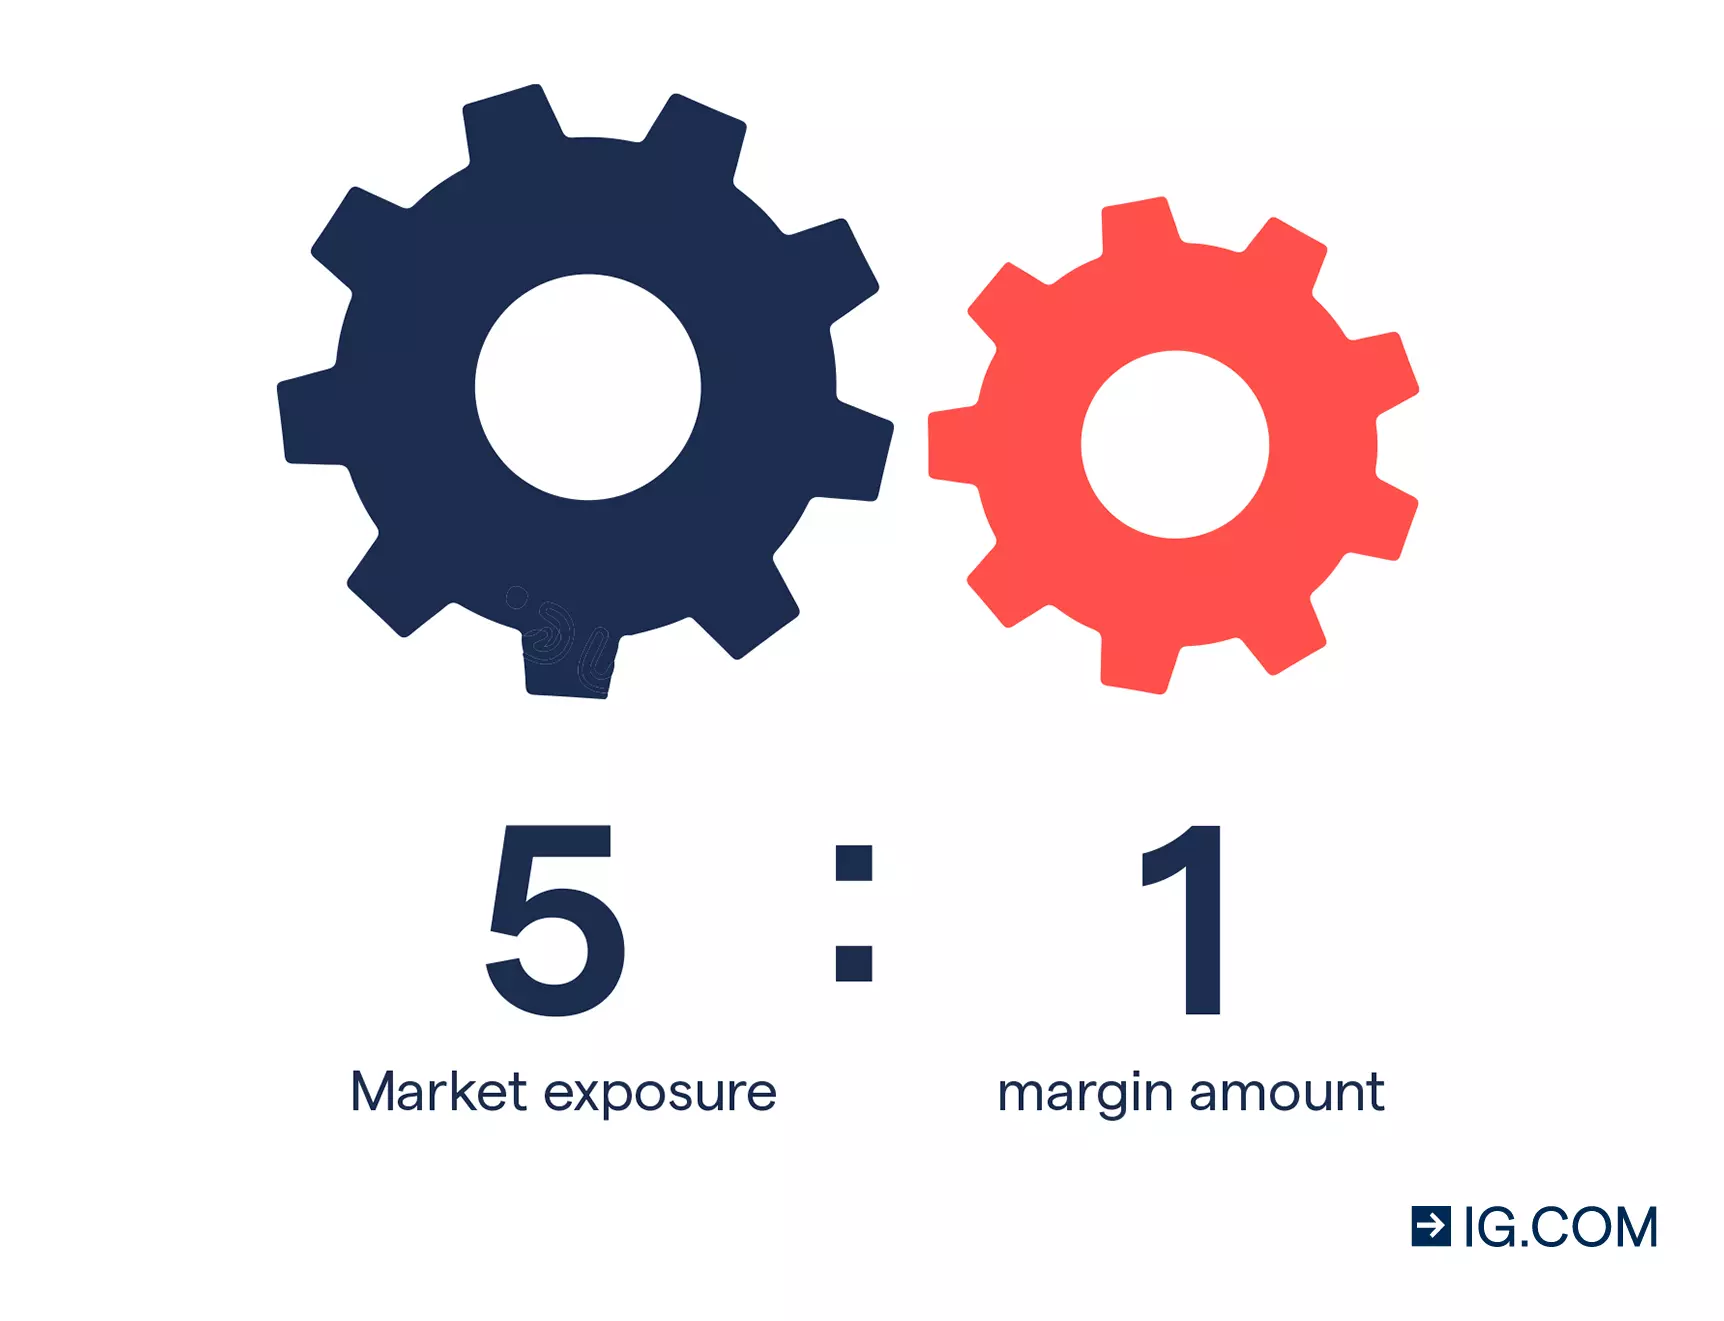
Trading on leverage means that you’ll put down a deposit – called margin – to get exposure to the full value of the position. For example, if you’ve bought 10 share CFDs on a stock trading at £100, your market exposure is £1000 (10 x £100). Because share CFDs might only require a margin deposit of 20%, your initial outlay will be £200.
It’s important to note that leverage amplifies both the profits and losses on your deposit. So, because your full exposure is still £1000, you can lose a lot more than your margin, unless you take steps to limit your risk.
At a deposit of 20%, your leverage ratio is 5:1. Here, every 1% change in the market price will result in a 5% change in your deposit. Referring to the above example, if the market price dropped to £90 (a 10% decline), your loss of £100 (-£10 x 10 shares) is already 50% of your deposit.
How to manage risk
To manage your risk, you have to take certain steps before opening a position – this includes the use of risk management tools, which we’ll explain below. Remember, risk management is essential when trading or investing in financial markets.
Risk management using stop-loss and limit orders
When trading with us, you can set stop-loss and limit orders to automatically close your positions at market levels you choose. A stop-loss caps your risk by closing your position when the market reaches a position that’s less favourable to you. Basically, by using a guaranteed stop, you’re establishing the maximum amount you stand to lose if the market moves against you.
We offer normal and guaranteed stops. A normal stop will trigger as soon as your target price is hit, but if a market jumps or ‘gaps’ while the order is being executed, there’s a chance that your position will close at a worse level than the order price. A guaranteed stop will prevent this ‘gapping’ (called slippage), but ’you'll pay a small premium if it’s triggered.
A limit order, on the other hand, closes your position automatically when the price is more favourable to you – locking in your profits.
Risk management through diversification
All assets face two types of risk: systematic (market) and unsystematic (idiosyncratic). Systematic risk relates to how the value of an asset changes based on the performance of the market and the wider economy. Idiosyncratic risk relates to the unique risk faced by each asset – such as changing regulations, supply disruptions and shifting consumer tastes.
Diversification lessens idiosyncratic risk by incorporating as many uncorrelated investments as possible. When a portfolio is highly diversified, idiosyncratic risk no longer exists, and only systematic risk remains.
Risk management and hedging
Hedging is often used to mitigate your losses if the market turns against you. It’s achieved by strategically placing trades so that a profit or loss in one position is offset by changes to the value of the other.
Any strategy adopted when hedging is primarily defensive in nature – meaning that it’s designed to minimise loss rather than maximising profit.
Typically, when hedging a trade, you’d either take an opposite position in a closely related market (or company), or the same position in a market that moves inversely to your original investment.
This should lessen the adverse effects of your losses if they occur. Hedging via CFDs means you can offset losses against profits for capital gains tax purposes.1
Learn more about hedging with spread bets and CFDs
Risk management using trading plans
One of the best ways to manage risk is to create a trading plan. It can help you to take the emotion out of decision making by setting out the parameters of every position.
A trading plan shouldn’t be mistaken for a trading strategy, which defines how and when you should enter and exit trades. Trading plans include a personal motivation for taking a position, the time commitment you want to make, and the strategies you’ll use to reach your goals.
Risk management using trading alerts
Trading alerts will trigger notifications to you when your specified market conditions are met. These alerts are free to customise, and they enable you to take the necessary action without constantly watching the markets.
With trading alerts, you can track movement on multiple accounts and get a notification the second that your target level or price change is hit.
Types of trading and investment risk
- Systematic and unsystematic risk
Systematic risk involves the probability of loss related to changes in the market that can’t be controlled. These changes include macroeconomic factors like politics, interest rates, and social and economic conditions, which could potentially influence the price in an adverse way.
Unsystematic risk relates to the possibility of loss that takes place on a microeconomic level. It’s normally associated with uncertainty about things that could be controlled, like managerial decisions or supply and demand in the industry.
- Business risk
Business risk is a threat to a company’s ability to meet its financial goals or payment of its debt. This risk may be a result of fluctuations in market forces, a change in the supply or demand for goods and services, or regulation being amended.
Business risk also exists when management decisions affect the company’s bottom line. This type of risk poses a threat to shareholders, because if a company goes bankrupt, common stockholders will be the last in line to receive their share of the proceeds when assets are sold.
- Volatility risk
Volatility risk is the possibility of loss due to the unpredictability of the market. If there’s uncertainty in the market, the trading range between asset price highs and lows becomes wider – exposing you to heightened levels of volatility.
So, it becomes important to track asset classes that display historical volatility to gauge future price changes. You can measure volatility using standard deviations, beta and options pricing models.
- Liquidity risk
Liquidity risk is the possibility of incurring loss because of the inability to buy or sell financial assets fast enough to get out of a position. When you have an open position but you can’t close it at your preferred level due to high liquidity, your position may result in a loss.
- Inflation risk
Inflation risk is the probability that the value of an asset (or your investment returns) will be affected by a decline in spending power. When inflation rises, there’s a threat that the cost of living will increase, plus a noticeable decline in buying power. As inflation rises, lenders change interest rates, which often leads to slow economic growth.
- Interest rate risk
Interest rate risk mostly affects long-term, fixed investments because fluctuations can cause a decline in the value of an asset. This type of risk the probability of an open position being adversely affected by exposure to changing interest rates.
When interest rates go up, the value of bonds will decline. On the other hand, when the interest rates go down, bonds will go up in value.
- Credit risk
Credit risk involves the probability of loss as a result of a company or individual defaulting on their repayment of a loan. A contractual obligation is created whereby the borrower agrees to repay a lender the principal amount, sometimes with interest included.
If you’re a trader, you’ll borrow from a broker to speculate on derivatives by only paying margin to open the position. This creates a credit risk for the lender if you don’t pay back what is owed.
- Counterparty risk
Counterparty risk is the potential of an individual, company or institution that’s involved in a trade or investment defaulting on their contractual responsibilities.
It’s generally when one party fails to meet the repayment obligations to get rid of the debt. Parties that have exposure to this risk include lenders (like banks) because they extend credit.
- Currency risk
Currency risk involves the possibility of loss if you have exposure to foreign exchange (forex) pairs.
This market is notoriously volatile, and there’s increased potential for unpredictable loss.
For example, if you buy shares in Amazon from the UK, you’ll have to convert your pounds to USD to purchase the shares – exposing you to currency risk. When the times comes that you want to sell your investment, the exchange rate might have changed quite significantly, and you’ll be at the mercy of the new rate.
- Call risk
Call risk relates to the possibility that a bond issuer may recall an investment before the maturity date.
The more time that passes after a coupon was issued, the lower the probability that the bond will be recalled.
Additionally, interest rates also play a major role in call risk being exercised. When interest rates drop, the issuer may call back the bond because they want to amend the terms of the bond to reflect the current rates.
FAQs
What are risk and reward?
Risk and reward are terms that refer to the probability of incurring a profit (upside) or loss (downside) as a result of a trading or investing decision. Risk is the uncertainty that you take on when opening a position, as the outcome may not be what you expected. Reward is the positive outcome of your position, for example a high dividend payment.
What is the risk-reward ratio?
The risk-reward ratio is a way of assessing potential returns that you stand to make for every unit of risk. For example, if you risk £100 and expect to make £300, the risk-reward ratio is 1:3, or 0.33.
How is risk measured?
Risk is measured using different methods and models, including variance and standard deviation, Value-at-Risk (VaR) and R/R ratio, while beta is preferred for a portfolio of stocks. Bear in mind that these are just tools to help you understand the risk-reward trade-off and by no means a watertight guide.
Can I practise trading risk-free?
Yes, you can practise trading risk-free when you create a demo account with us. Your account will be credited with £10,000 in virtual funds for you to experiment which strategy works the best before you create a live account.
How can I manage risk?
You can manage risk by using a variety of tools available on our platform. These include stop-loss and limit orders. Setting up a stop-loss order can mitigate losses while a limit order can lock in profits.
You can choose between a normal stop or a guaranteed stop. A normal stop will close your position automatically when the market reaches a level that is less favourable to you. When your order is triggered at the stop level, it means it can be executed at a worse level in volatile markets. A guaranteed stop protects against possible slippage, but incurs a fee if it’s triggered.
A limit order will automatically close your position when the market reaches a more favourable position.
Can I hedge with CFDs?
Yes, you can hedge with CFDs by taking an opposite stance from your initial trade so that a gain or loss in one position is offset by changes to the value of the other
Try these next
Learn how trading works and how to speculate on price movements
Explore the differences between trading and investing with us
Discover how to manage your risk when trading and investing
1 Tax laws are subject to change and depend on individual circumstances. Tax law may differ in a jurisdiction other than the UK.
Connect with us
Spread bets and CFDs are complex instruments and come with a high risk of losing money rapidly due to leverage. 68% of retail investor accounts lose money when trading spread bets and CFDs with this provider. You should consider whether you understand how spread bets and CFDs work and whether you can afford to take the high risk of losing your money.
Professional clients trading spread bets and CFDs can lose more than they deposit.
The value of shares, ETFs and other ETPs bought through a share dealing account, a stocks and shares ISA or a SIPP can fall as well as rise, which could mean getting back less than you originally put in. Past performance is no guarantee of future results. Some ETPs carry additional risks depending on how they’re structured, investors should ensure they familiarise themselves with the differences before investing.
Share dealing and IG Smart Portfolio accounts provided by IG Trading and Investments Ltd, CFD accounts and futures accounts are provided by IG Markets Ltd, spread betting provided by IG Index Ltd.
IG is a trading name of IG Trading and Investments Ltd (a company registered in England and Wales under number 11628764), IG Markets Ltd (a company registered in England and Wales under number 04008957) and IG Index Ltd (a company registered in England and Wales under number 01190902). Registered address at Cannon Bridge House, 25 Dowgate Hill, London EC4R 2YA. IG Markets Ltd (Register number 195355), IG Trading and Investments Ltd (Register Number 944492) and IG Index Ltd (Register number 114059) are authorised and regulated by the Financial Conduct Authority.
The information on this site isn’t directed at residents of the United States, Belgium or any particular country outside the UK and isn’t intended for distribution to, or use by, any person in any country or jurisdiction where such distribution or use would be contrary to local law or regulation.