Price action strategy: a complete guide for traders
Price action trading is a strategy that helps to predict market movements by spotting patterns or ‘signals’ in the price movements of an underlying market. Learn about some different price action strategies here.


What’s on this page?
What is price action in trading?
Price action in trading analyses the performance of a security, index, commodity or currency to predict what it might do in the future. If your price action analysis tells you that the price is about to rise, you might want to take a long position, or if you believe that the price will fall, you might choose to short the asset.
Understanding price action trading involves looking at patterns and identifying the key indicators that might have an impact on your investments. There are a number of different price action methods that many traders use to predict market movements and make short-term gains.
What do ‘pure’ or ‘naked’ price action mean?
Naked price action – also known as pure price action – means that you are making your trades based solely on the prices that you can see before you. It’s sort of like driving with your sat nav turned off. Instead of relying on complex formulas and time consuming analysis, you make your trades using your own understanding of the market.
What are price action signals?
Price action signals – sometimes called price action patterns, or price action triggers – are easily-recognisable patterns in a market, which can be used to predict future market behaviour. Experienced traders can sometimes spot these signals at a glance by recognising certain shapes or repetitions in past performance.
Price action vs indicators vs technical analysis: what is the difference?
Price action indicators are flickers of activity on a trading chart that signal the emergence of a trend. Seasoned traders can spot these indicators quickly and use them to make informed bets on the market in real time.
Technical analysis uses a range of different calculations to predict future price movements. By contrast, price action relies only on the price movements of an asset within your trading timeframe.
In a way, technical analysis is attempting to find order within the seemingly chaotic world of trading, while price action allows the trader to take a more traditional gut-based trading approach by spotting price action indicators and acting on them.
Why is price action popular among forex traders?
The forex market is particularly popular with price action traders for a few reasons.
- It’s highly liquid, so traders might find it easier to open and close their positions quickly
- The forex market is always moving, but rarely experiences big highs and lows. This makes it ideal for new traders who want to experiment with smaller trades before scaling up as their expertise grows
- The maturity of the market makes it easier to spot recurring patterns and trends
How to trade using price action: tips to get started
To start price action trading, just follow these six steps:
- Create an account or log in
- Identify the market you want to trade
- Build a personalised trading plan
- Decide whether to go long or short
- Open and monitor your position
Top seven trading strategies with price action signals
Price action trend trading
If price action trading is the study of price movements, price action trend trading is the study of trends. Traders can make use of a number of trading techniques to spot and follow price action trends such as the head and shoulders trade reversal.
This is a great trading tool for new traders, as it allows them to effectively learn from their more experienced peers by chasing price action trends as they become visible. In the screengrab below, you’d open a ‘buy’ position to benefit from the green uptrends, or a ‘sell’ position to benefit from the red downtrends.
Pin bar
Sometimes called the candlestick strategy because of its distinctive shape, the pin bar pattern looks like a candle with a long wick on it. It represents a sharp reversal and rejection of a particular price, with the ‘wick’ or tail showing the range of price that was rejected.
The assumption is that the price will continue to move in the opposite direction to the tail, and traders will use this information to decide whether to take a long or short position in the market. For example, if the pin bar pattern has a long lower tail, this tells the trader that there has been a trend of lower prices being rejected, which implies that the price could be about to rise.
Inside bar
The inside bar pattern is a two-bar strategy, where the inner bar is smaller than the outer bar, and falls within the high and low range of the outer bar (or mother bar). Inside bars often form during a moment of consolidation in the market, but they can also act as a red herring, signalling a turning point in the market.
Skilled traders can spot this trend at a glance, and should be able to use their macro knowledge to predict whether the inside bar represents consolidation or a shift in the prevailing trend. The size and position of the inside bar will dictate whether a price is more likely to go up or down.
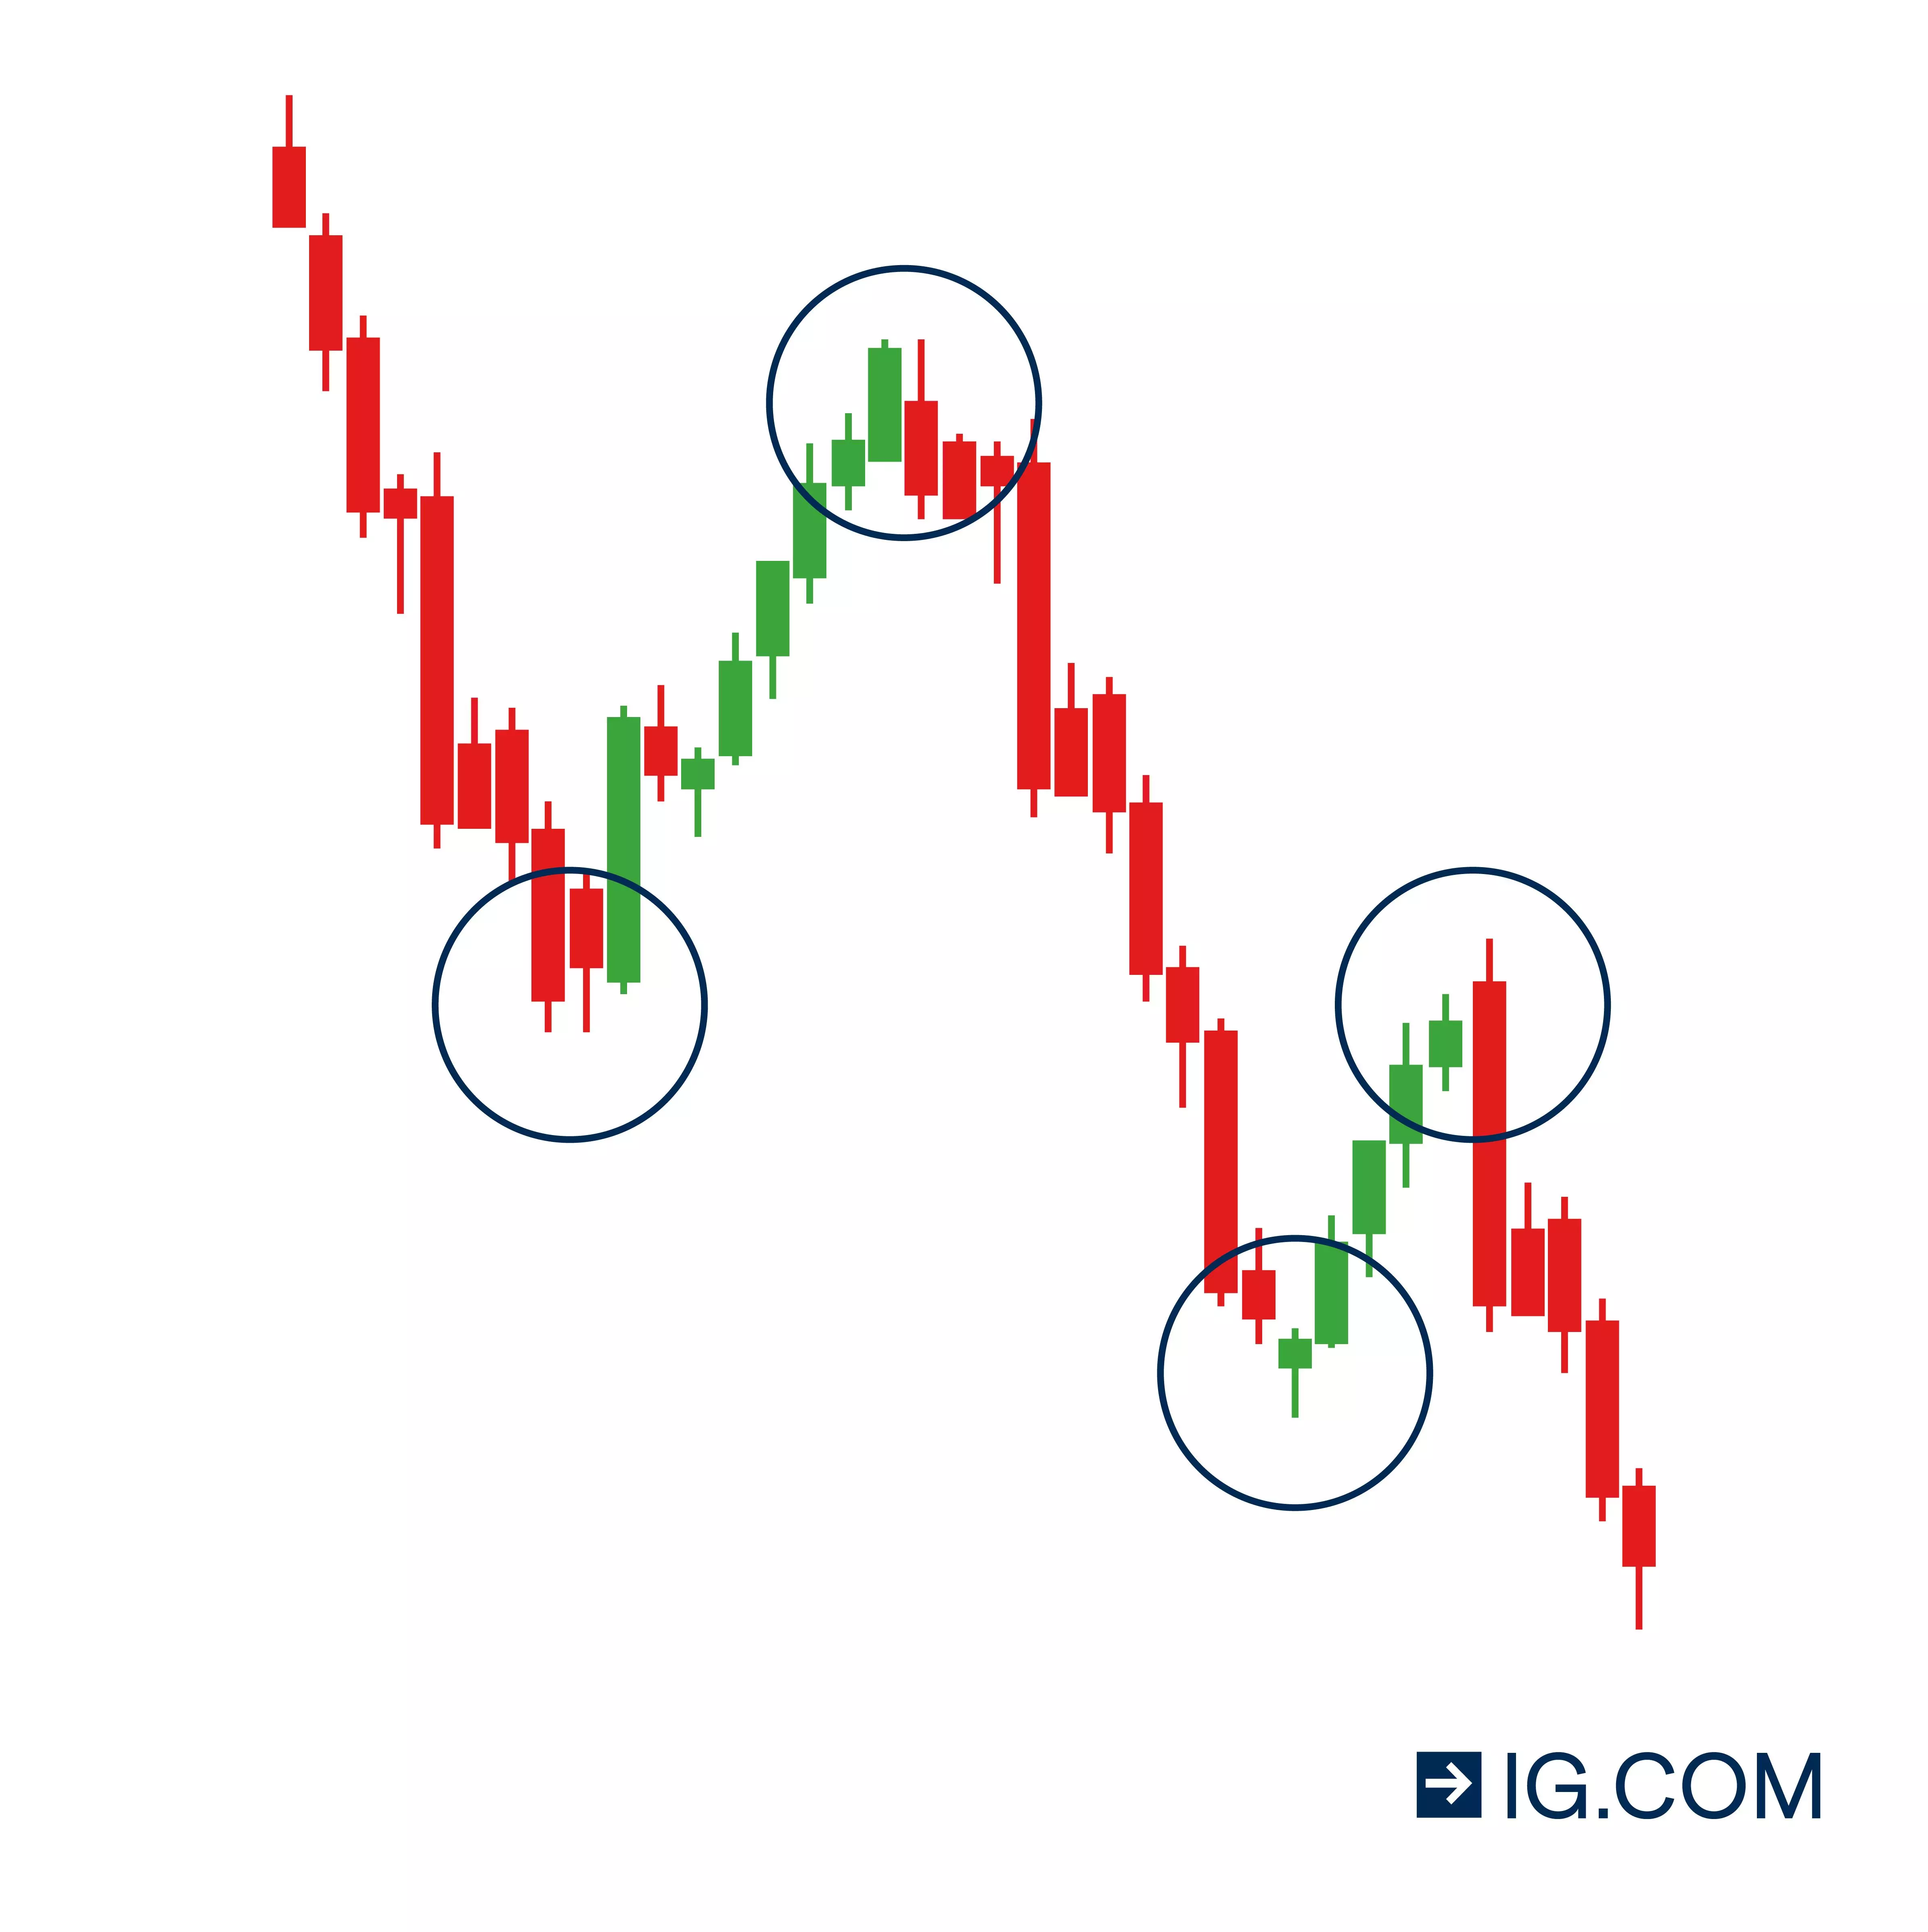
Trend following retracement entry
This is a relatively simple price action strategy whereby the trader simply follows the existing trend.
If a price is on a clear downturn, with lower highs being consistently created, the trader might look to take a short position. If prices are rising incrementally, with the highs and lows trending increasingly higher, then the trader might want to buy in.
Trend following breakout entry
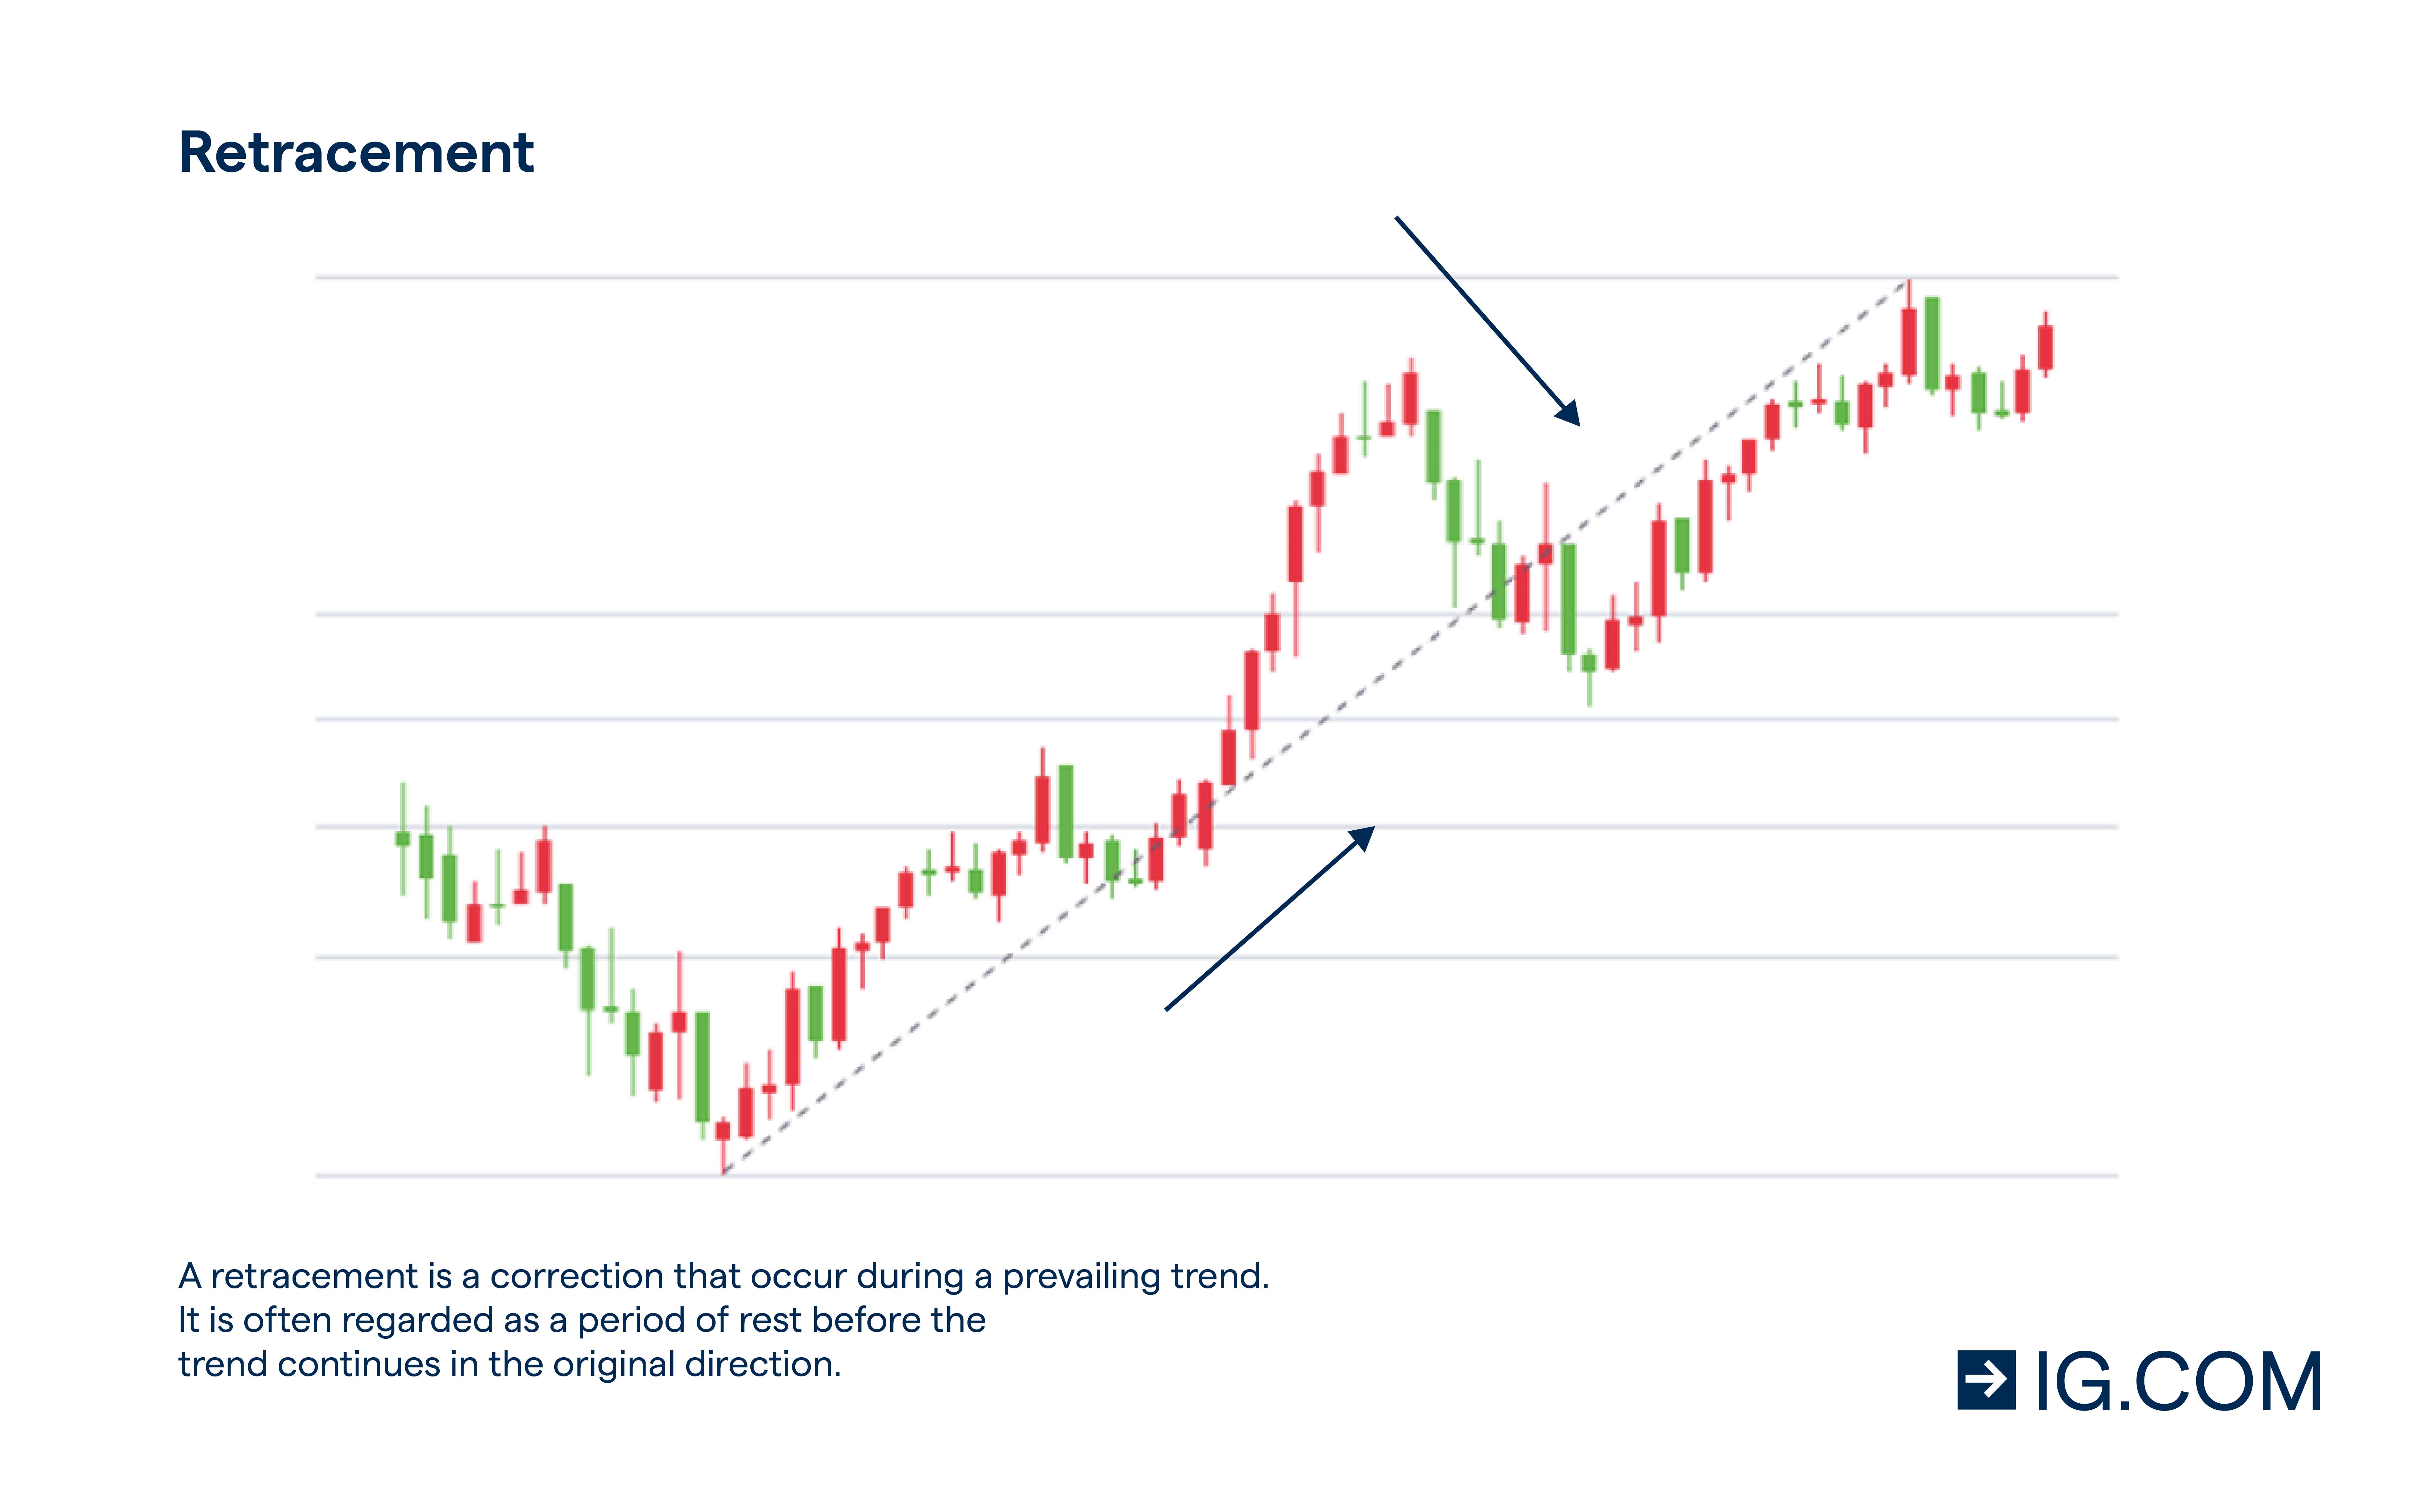
This trend tracks any major movements in the market under the assumption that after a price spike, a retracement will follow. If a market moves outside a defined support or resistance line, it’s known as a breakout.
Traders can use this as a signal to act, taking a long position if the stock is trending upwards or breaks above the resistance line, or a short position if it moves below the support line.
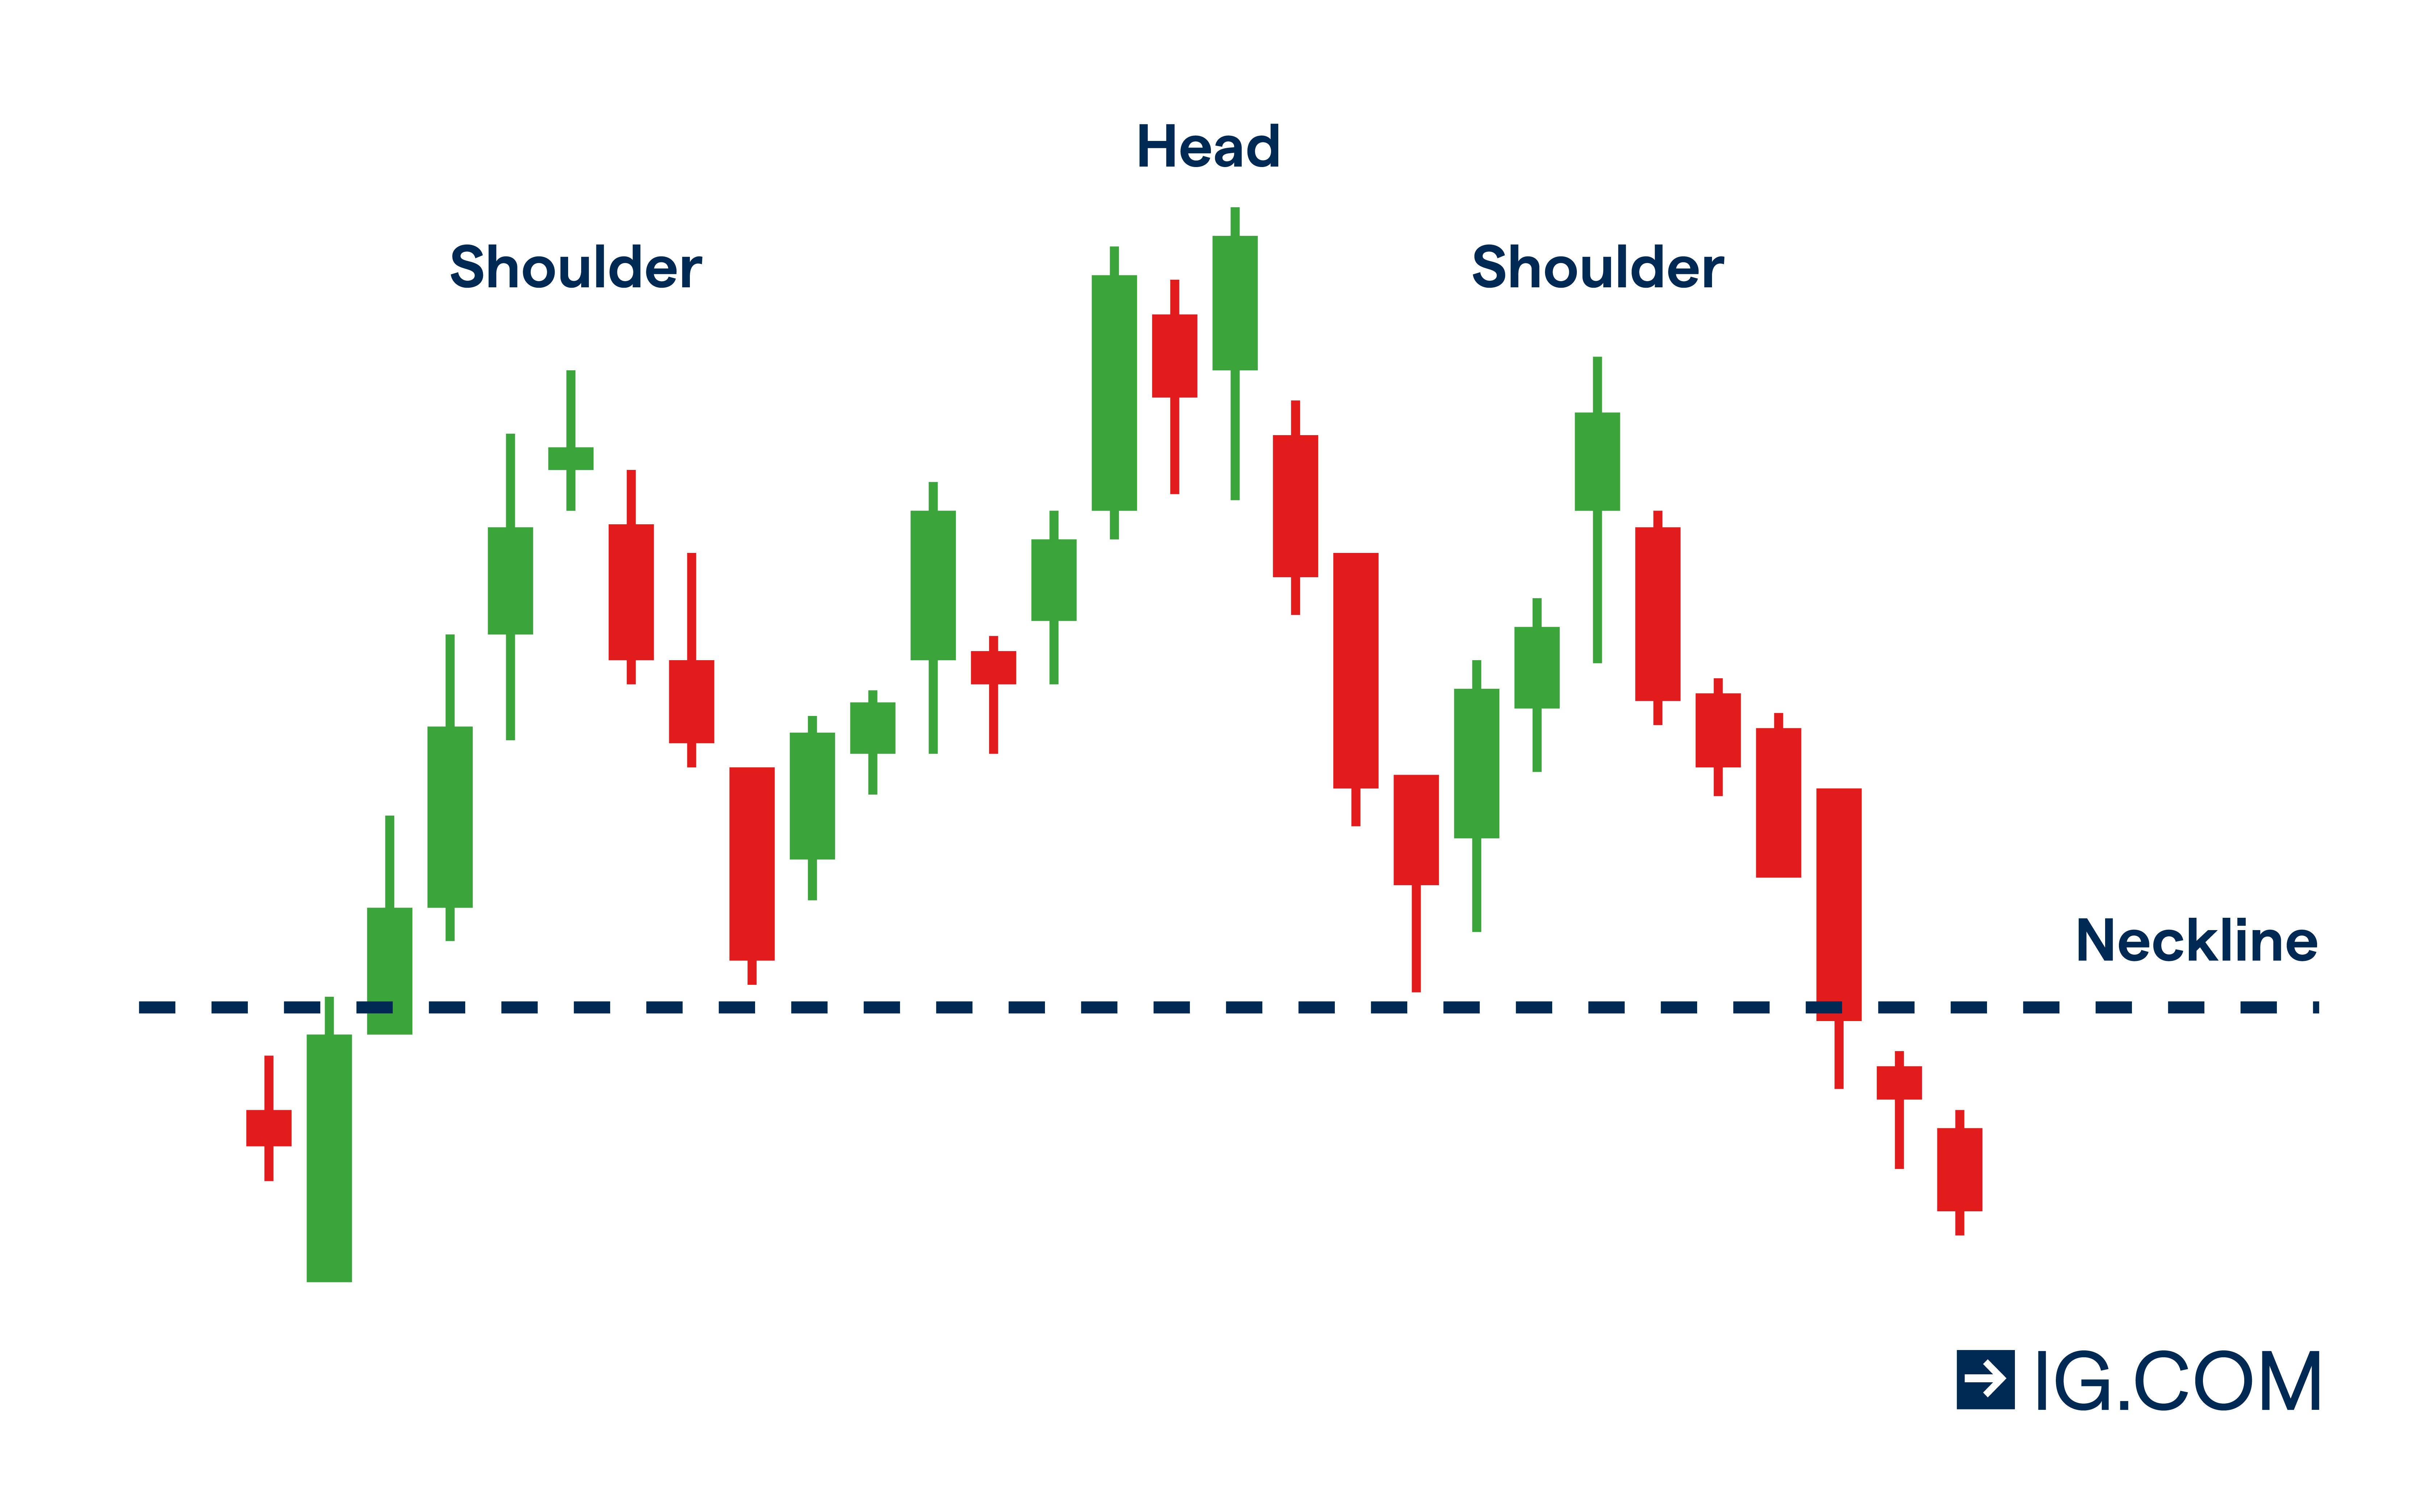
Head and shoulders reversal trade
As the name suggests, the head and shoulders pattern is a market movement that looks a bit like the silhouette of a head and shoulders. In other words, prices rise, fall, rise even further, fall again, and rise to a lower high before a modest drop.
The head and shoulders reversal trade is one of the most popular price action trading strategies as it’s relatively easy to choose an entry point (generally right after the first shoulder) and to set a stop loss (after the second shoulder) to take advantage of a temporary peak (the head).
The sequence of highs and lows
At its core, price action trading is a game of highs and lows. Price action traders can follow the sequence of highs and lows strategy to map out emerging trends in their market.
For example, if a price is trading at higher highs and higher lows, this indicates that it’s on an upward trend. If it’s trading at lower highs and lows, it’s trending downwards. Traders can use their knowledge of the sequence of highs and lows to choose an entry point at the lower end of an upward trend, and by setting a stop just before the previous higher low.
Price action trading summed up
Price action trading is a trading strategy which uses the price movements of an underlying market to attempt to predict future market movements
- Traders look out for price action signals which indicate the emergence of a trend
- Unlike technical analysis, price action trading focuses on the actual price, not on moving averages
- It’s particularly popular with FX traders due to the liquidity and size of the forex market
- Different price action methods can be used by traders to predict market movements and make short-term gains
Open an account to get started
This information has been prepared by IG, a trading name of IG Markets Limited. In addition to the disclaimer below, the material on this page does not contain a record of our trading prices, or an offer of, or solicitation for, a transaction in any financial instrument. IG accepts no responsibility for any use that may be made of these comments and for any consequences that result. No representation or warranty is given as to the accuracy or completeness of this information. Consequently any person acting on it does so entirely at their own risk. Any research provided does not have regard to the specific investment objectives, financial situation and needs of any specific person who may receive it. It has not been prepared in accordance with legal requirements designed to promote the independence of investment research and as such is considered to be a marketing communication. Although we are not specifically constrained from dealing ahead of our recommendations we do not seek to take advantage of them before they are provided to our clients. See full non-independent research disclaimer and quarterly summary.

Discover how to trade the markets
Explore the range of markets you can trade – and learn how they work – with IG Academy's free ’introducing the financial markets’ course.