Gold to silver ratio trading strategies
We explain what the gold to silver ratio is and how to use it as part of your trading strategy.

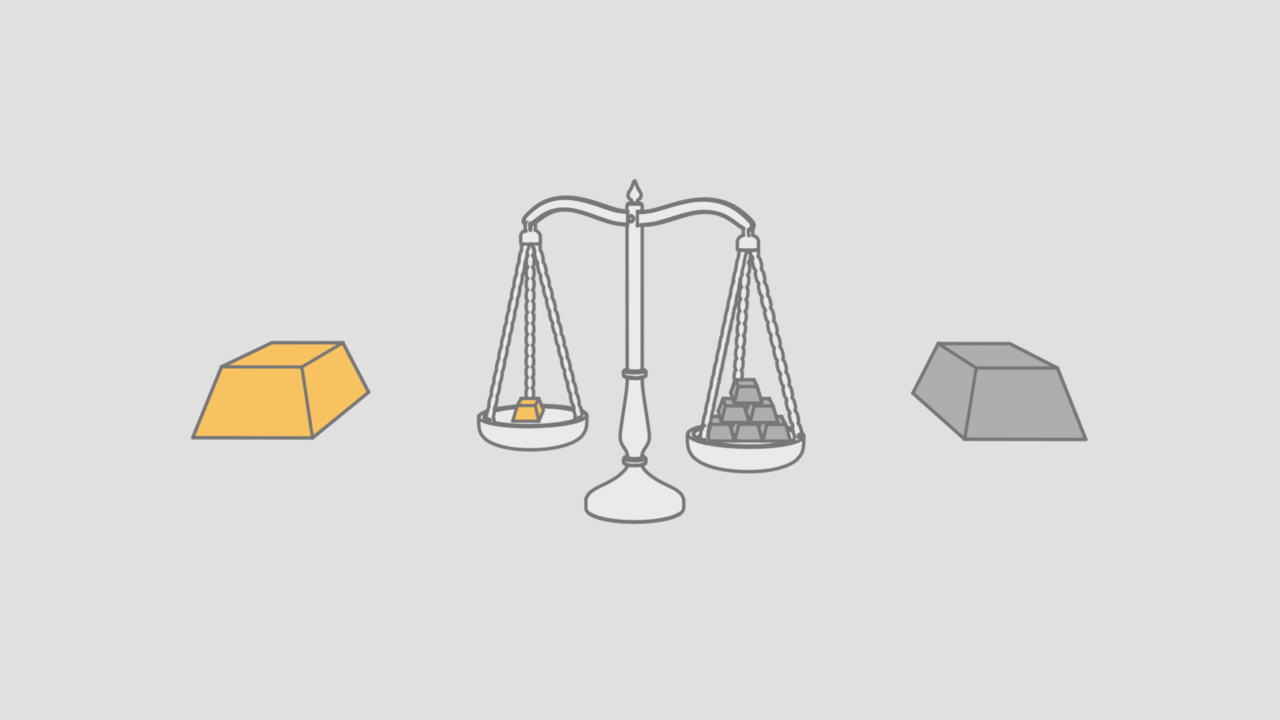

What is the gold to silver ratio?
The gold to silver ratio represents the value of gold relative to silver and can provide insight into how the price of each metal could move against the other.
How to calculate the gold to silver ratio
Calculating the gold to silver ratio is simple: it is the price of gold divided by the price of silver. This represents how many ounces of silver you would have to sell to buy one ounce of gold, or how many silver ounces you could buy with the money made selling one ounce of gold.
The ratio generally remains between 10 to 100, but technically there is no reason why it could not go higher or lower than those parameters.
As of 7 February 2019, gold was trading at roughly $1,306 per ounce while the price of silver was just below $16,00. This calculates to a gold to silver ratio of 82 (1306/16).
What affects the gold to silver ratio?
The gold to silver ratio is dictated by the price of each metal and how fast they are rising or falling compared to the other. The price of the two metals tend to correlate most of the time so changes are often a result of the price of one metal increasing or decreasing at a faster rate:
- If the price of gold is rising at a faster rate than silver, then the ratio will increase
- If the price of silver is rising at a faster rate than gold, then the ratio will decrease
- If the price of gold is falling at a faster rate than silver, then the ratio will decrease
- If the price of silver is falling at a faster rate than gold, then the ratio will increase
While some factors can impact the price of both metals, such as movements in the US dollar, it is important to stress that the prices of gold and silver are determined and driven by their own factors.
Gold is purchased by four different markets: jewellery, industrial applications, central banks and investors. Gold holds a unique role in commodity markets as a ‘safe haven’ asset (an ability to retain its value) that investors flock to when other financial markets – such as forex or stocks – are volatile.
Investor sentiment is therefore a major driver behind the price of gold, rising in times of uncertainty as people look to buy the metal as a form of insurance to hedge against potential declines in other parts of their investment portfolio. This is less true for the price of silver, which has more industrial applications than its sister metal. For this reason, some use the gold to silver ratio to test investor sentiment: if the ratio is high then it suggests the gold price has strengthened at a faster rate than silver to imply investors have become more risk-averse, while a low ratio could suggest interest in gold is lower to imply investors feel confident about the growth and stability of the world economy.
Learn more about why gold is valuable and what moves the price
There are a variety of variables that affect the price of gold and silver, and therefore the ratio between the two. This is demonstrated by changes to the ratio over different eras.
Gold to silver ratio chart: a brief history
The historic highs and lows of the ratio can often be attributed by major events. For example, the end of WW1 brought about peace and revived economic growth to push the ratio to below 18, but then ratcheted up in the lead up to WW2 to over 97 as investors flocked to gold as a safe haven.
More recently, the ratio hit its all-time low of less than 15 in 1979 when US interest rates were hiked to 21% to counter rampant inflation (higher interest rates pushes down the price of gold). It then went on to hit an all-time high of 99 as a global recession began to take hold in the early 1990s.
Learn more about what happened on Black Wednesday in 1992
In the most recent financial crash, the gold to silver ratio moved from a peak of 80 in late 2008 to 32 in early 2011.

How to trade the gold to silver ratio
But how do you use the ratio in trading? In a nutshell, if the ratio is outside the average then it can signal an opportunity to trade gold and/or silver with a view of profiting when it returns to ‘normal’ levels.
There is no definition of a ‘normal’ level, but historic data does paint some parameters for investors to use:

With this in mind, today’s ratio of above 80 is high compared to average levels seen over the last 50 or so years. The idea is that a high ratio means the value of gold is relatively expensive compared to silver, with a low ratio implying the opposite. This means investors tend to buy gold when the ratio is low and silver when it is high.
Although the ratio can experience volatile movements of 10+ points in a month, the drastic swings from the highs to the lows tend to occur over longer timeframes. The ratio has rarely been above 80 or below 50 over more recent decades, and therefore these levels are potential turning points when the trend could begin to reverse.
If the ratio is trending, and gold and silver prices are trending, then the trading signal is:
| Upward | Upward | Buy gold |
| Upward | Downward | Sell silver |
| Downward | Upward | Buy silver |
| Downward | Downward | Sell gold |
Equally, there are opportunities for investors when the ratio reaches new highs or lows:
If the ratio is at a certain level, and gold and silver prices are trending, then the trading signal is:
| Historic high | Upward | Long silver |
| Historic high | Downward | Short gold |
| Historic low | Downward | Short silver |
| Historic low | Upward | Long gold |
Gold to silver ratio trading example
One investor notices the ratio is at 80, high compared to the historic average. They decide to sell one ounce of gold and purchase 80 ounces of silver. A few years later, the ratio has fallen to 20, low compared to the historic average, and the investor can trade their 80 ounces of silver for four ounces of gold, quadrupling their original investment. Repeating this would build up an investor’s overall inventory of gold and silver as they switch from one to another depending on whether the ratio is high or low.
Conclusion: gold to silver ratio is a valuable tool for investors
The gold to silver ratio is a representation of the value of each metal relative to the other that helps identify when either one may be undervalued or overvalued. It is most effective for longer-term strategies due to the stability of prices compared to other instruments.
The ratio changes when gold and silver prices move in different directions or, more commonly, when one rises or falls at a faster rate than the other. A high ratio suggests gold is expensive relative to silver, while a low ratio implies the opposite.
The ratio can also be used to gauge the market’s sentiment about the wider picture, making it a valuable tool that can be used beyond trading in precious metals. A high ratio has previously preluded economic downturns and emerges, as it has now, when global growth is slowing and uncertainty is high. A low ratio is often seen during times of peace and prosperity.
This information has been prepared by IG, a trading name of IG Markets Limited. In addition to the disclaimer below, the material on this page does not contain a record of our trading prices, or an offer of, or solicitation for, a transaction in any financial instrument. IG accepts no responsibility for any use that may be made of these comments and for any consequences that result. No representation or warranty is given as to the accuracy or completeness of this information. Consequently any person acting on it does so entirely at their own risk. Any research provided does not have regard to the specific investment objectives, financial situation and needs of any specific person who may receive it. It has not been prepared in accordance with legal requirements designed to promote the independence of investment research and as such is considered to be a marketing communication. Although we are not specifically constrained from dealing ahead of our recommendations we do not seek to take advantage of them before they are provided to our clients. See full non-independent research disclaimer and quarterly summary.

Discover how to trade the markets
Explore the range of markets you can trade – and learn how they work – with IG Academy's free ’introducing the financial markets’ course.