What are trading indicators? 10 technical indicators every trader should know
Trading indicators are tools used in technical analysis to help traders interpret price behaviour, identify trends and assess market conditions. While they can highlight opportunities, they don’t guarantee profits - and trading always carries the risk of loss.
In this guide, we explain what technical indicators are, how they work, and the best trading indicators commonly used across stocks, forex, indices and commodities.


Key Takeaway
Trading indicators are tools that help traders interpret price movements, trends and market momentum, but they aren’t reliable predictors on their own. Most traders use them as a guide alongside broader analysis and strict risk management, rather than treating them as automatic signals to buy or sell.
What are trading indicators?
Trading indicators - also called technical indicators or technical analysis indicators - are mathematical formulas plotted on charts to help interpret market behaviour. They transform raw price data into visual signals that can reveal trends, momentum or volatility.
Indicators generally fall into two categories:
- Leading indicators - these attempt to signal potential future movements
- Lagging indicators - these confirm trends after they begin
Most traders combine both types to help reduce false signals. Relying on a single indicator in isolation can be risky, as markets are influenced by many unpredictable factors.
(You can learn more about chart-based analysis in our guide to technical analysis principles.)
Why traders use technical indicators
Traders use indicators to support decision-making, not replace it. Properly applied, they can help answer key questions such as:
- Is the market trending or ranging?
- Is momentum strengthening or weakening?
- Is an asset potentially overbought or oversold?
- How volatile is the market right now?
However, indicators interpret past data, meaning they cannot account for unexpected events such as economic announcements or geopolitical shocks.
For a broader foundation, see our guide to risk management in trading.
The 10 (reputed) best trading indicators explained
There is no universally “best” indicator - different tools suit different strategies, timeframes and asset classes. Below are some of the most widely used technical analysis indicators across financial markets.
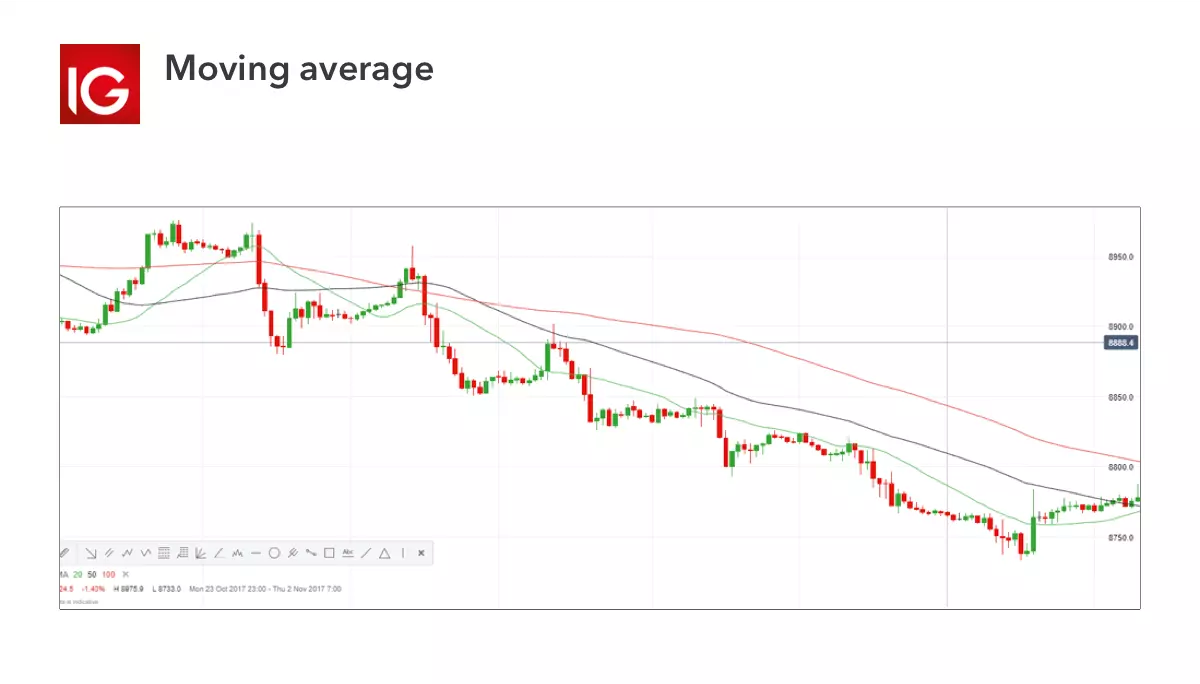
Moving average (MA)
A moving average smooths price data to reveal the underlying trend. By averaging prices over a set period, it filters out short-term noise and helps to highlight direction.
Long-term investors often use moving averages to identify broad trends, while shorter-term traders may watch for price crossing above or below the line as a potential signal. Moving averages can also act as dynamic support or resistance levels.
Learn more about this in our guide to moving averages.
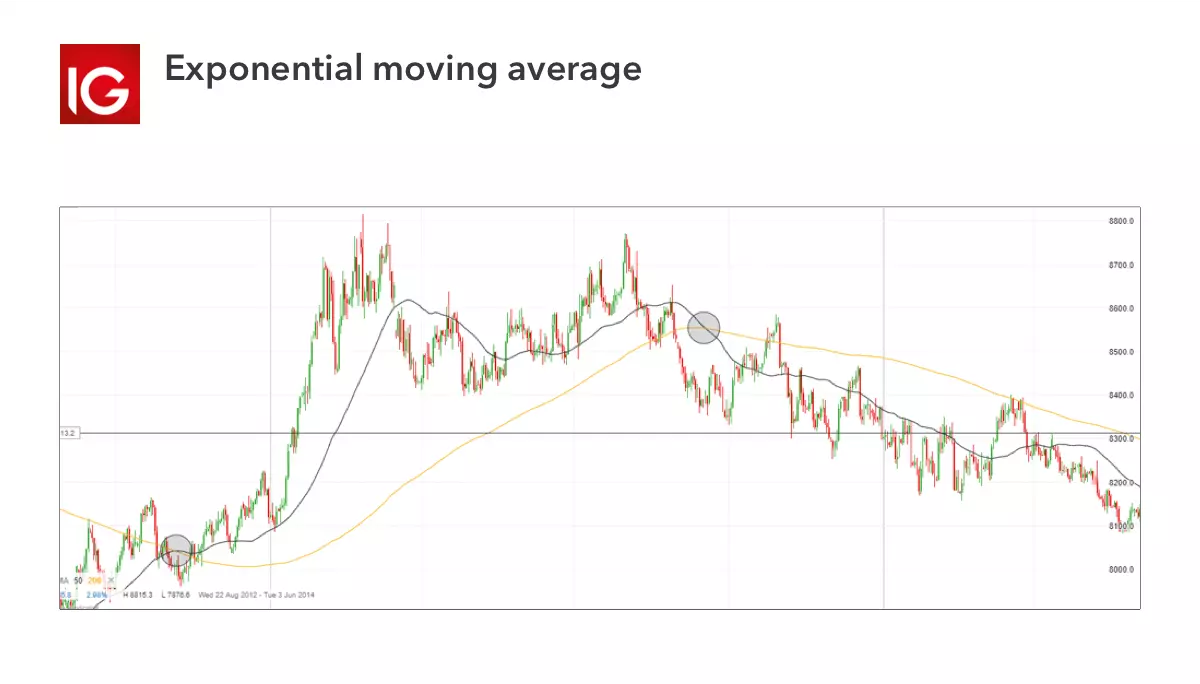
Exponential moving average (EMA)
An EMA is a variation of the moving average that gives more weight to recent prices, making it more responsive to new information. This responsiveness makes EMAs popular among those looking for the best indicators for day trading, where speed matters.
Short-term traders frequently use combinations such as 9 and 21-period EMAs to gauge momentum shifts, though faster signals can also increase false alarms in choppy markets.
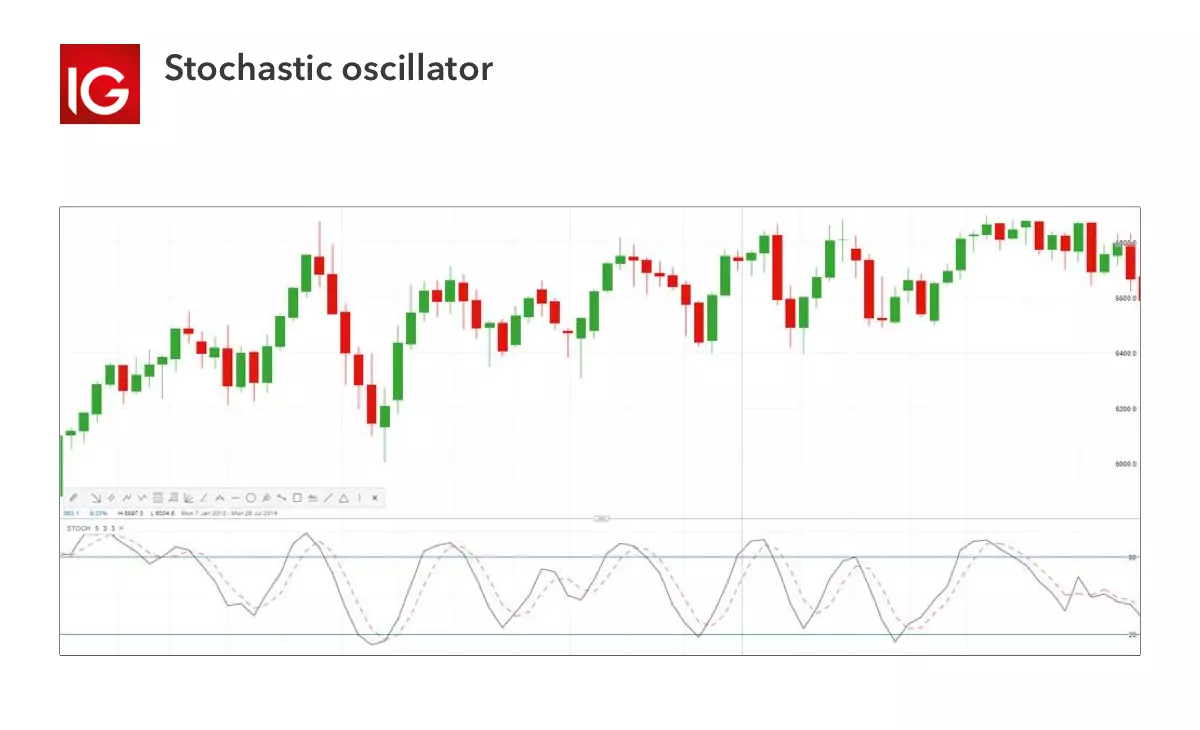
Stochastic oscillator
The stochastic oscillator measures momentum by comparing an asset’s closing price to its recent trading range. It oscillates between 0 and 100, with readings above 80 often interpreted as overbought and below 20 as oversold.
In strong trends, however, markets can remain overbought or oversold for extended periods, meaning signals should be confirmed with other analysis rather than acted on in isolation.
Moving Average Convergence Divergence (MACD)
MACD is one of the most widely used market indicators for measuring momentum. It compares two moving averages to show whether momentum is strengthening or weakening.
Crossovers between the MACD line and signal line are sometimes interpreted as potential entry or exit points, but like all indicators, they can produce misleading signals during sideways markets.
.png/jcr:content/renditions/original-size.webp)
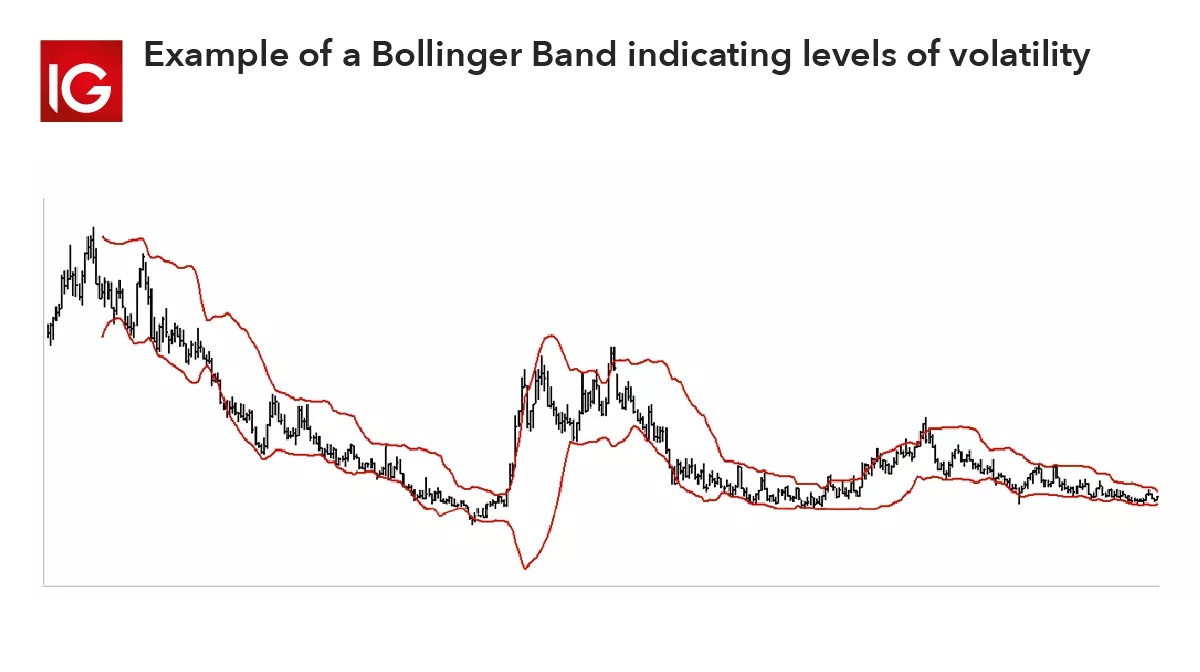
Bollinger Bands
Bollinger Bands plot a moving average with upper and lower bands based on volatility. When markets are calm, the bands contract; during turbulent periods, they expand.
Prices touching or moving outside the bands may indicate unusual conditions - though this does not necessarily mean a reversal is imminent. In strong trends, prices can “walk the band” for extended periods.
Relative Strength Index (RSI)
RSI measures the speed and magnitude of price movements. Values above 70 are commonly interpreted as overbought, while below 30 suggests oversold conditions.
Many traders use RSI to assess momentum exhaustion, but it is most effective when combined with trend analysis. An asset can remain overbought for long periods in a strong uptrend.
.png/jcr:content/renditions/original-size.webp)
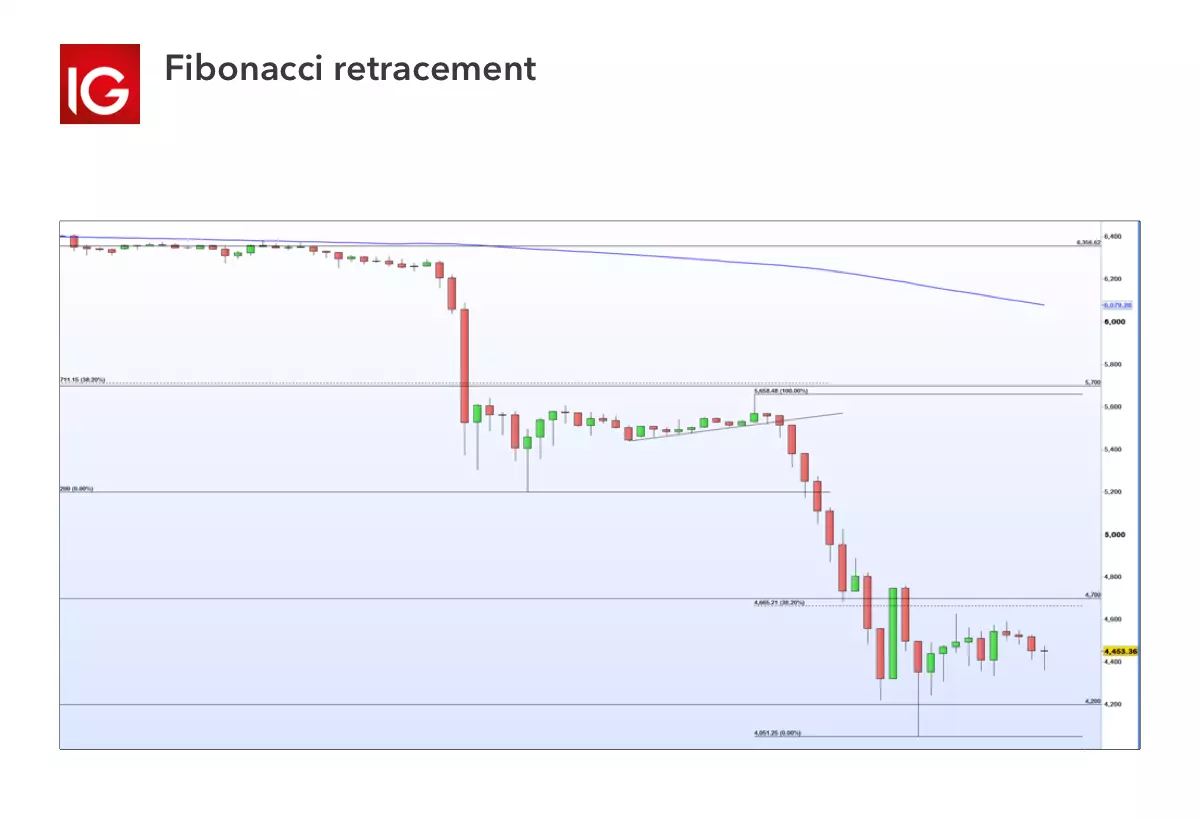
Fibonacci retracement
Fibonacci retracement tools identify potential support and resistance levels based on key ratios derived from the Fibonacci sequence. Traders use these levels to estimate where pullbacks might pause before the prevailing trend resumes.
Because these levels are widely watched, they can sometimes become self-fulfilling - but they are not guaranteed to hold.
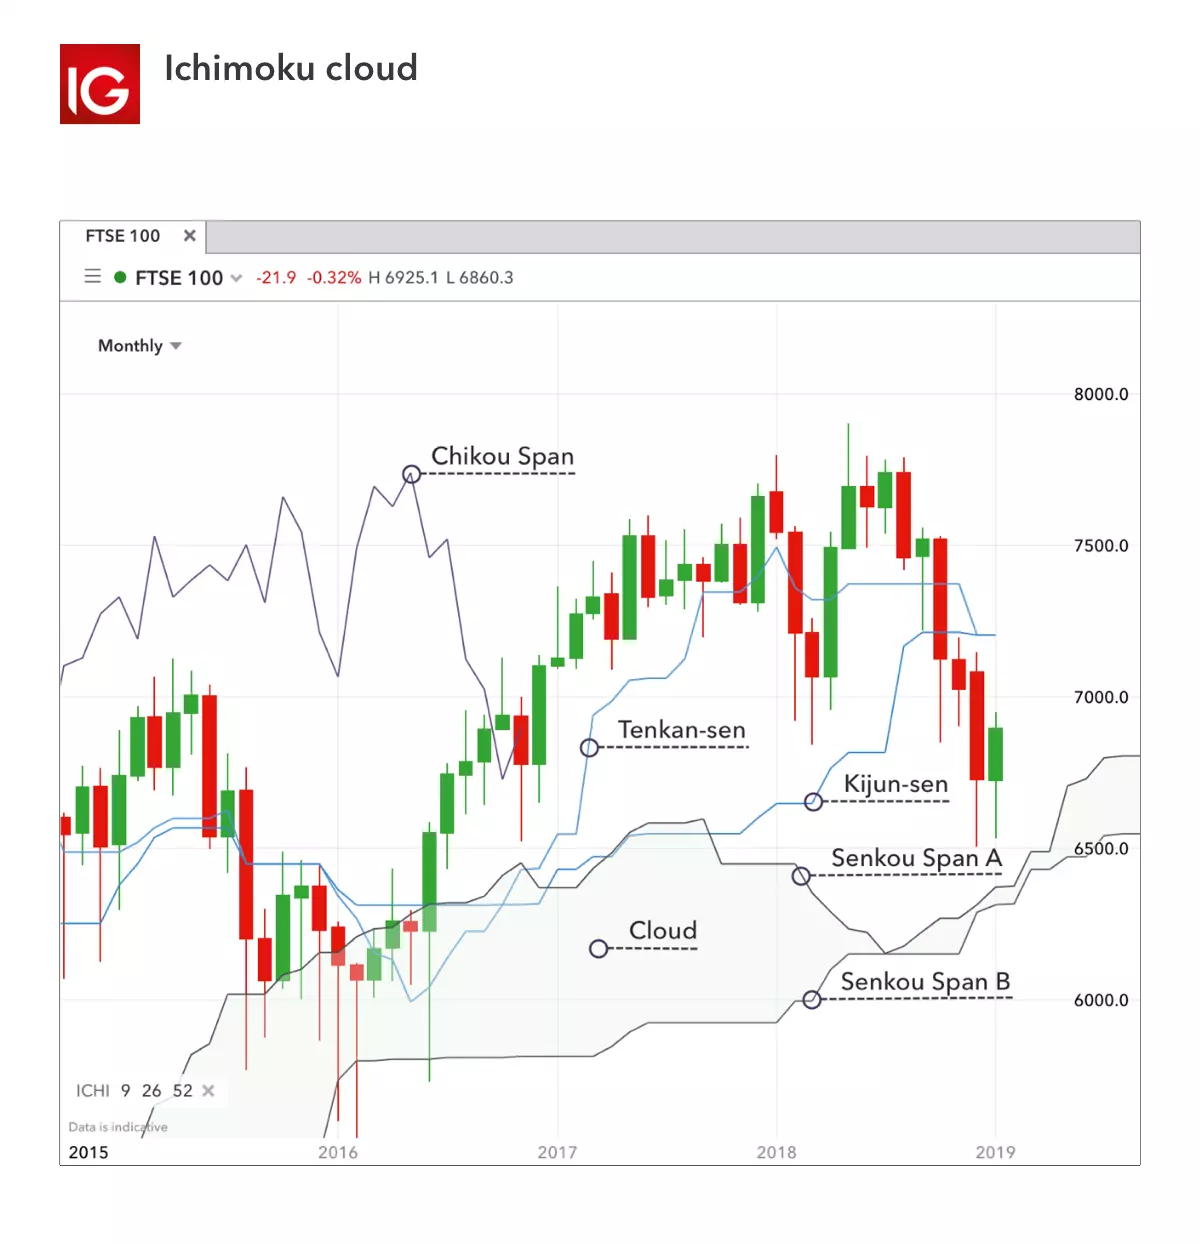
Ichimoku Cloud
The Ichimoku Cloud provides a comprehensive snapshot of trend direction, momentum and support/resistance in a single view. It is particularly useful for traders who want a multi-dimensional perspective without layering multiple indicators.
However, its complexity can be overwhelming for beginners, and interpreting signals correctly requires practice.
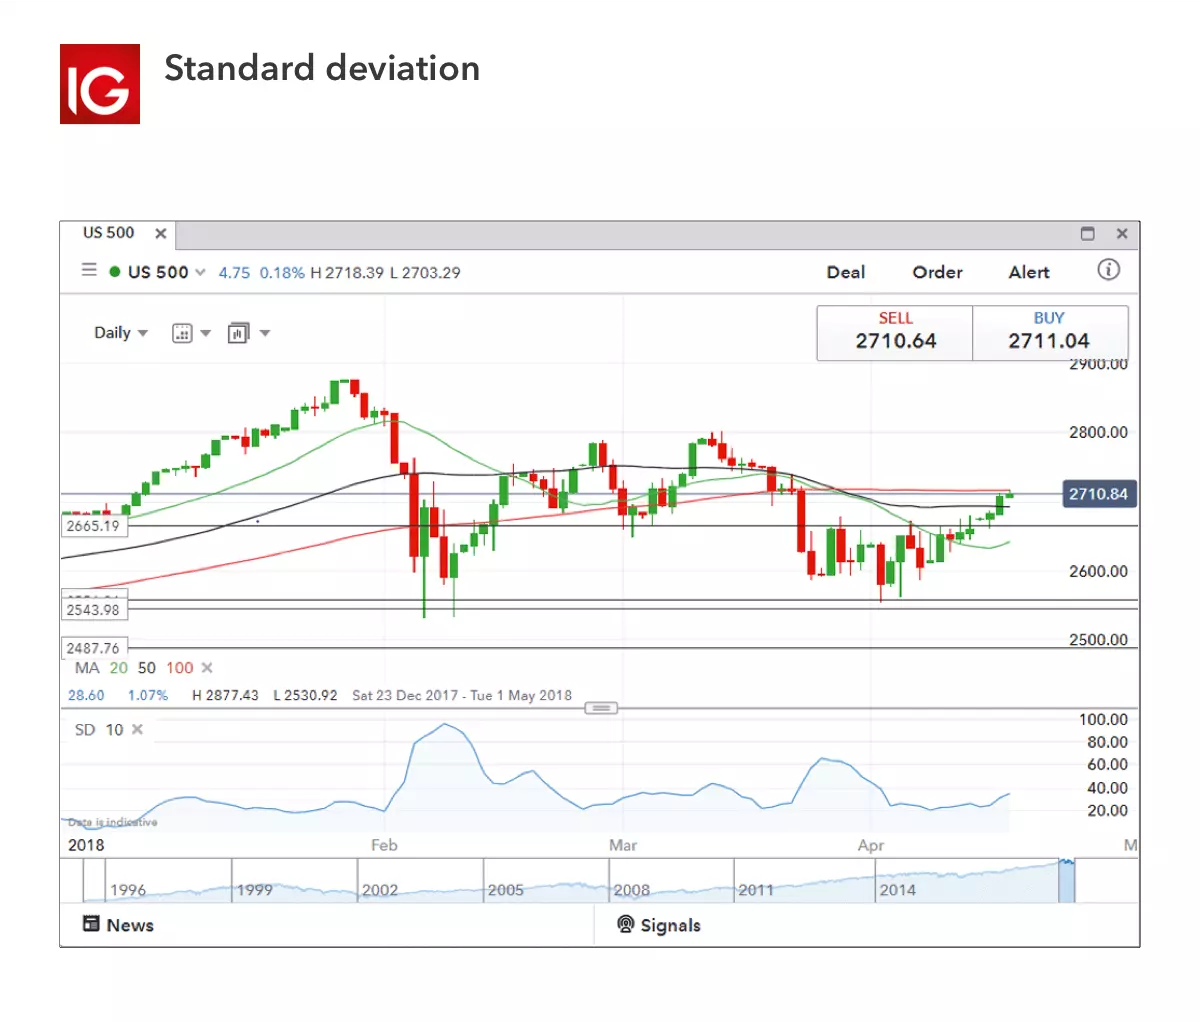
Standard deviation
Standard deviation measures volatility - specifically how much prices deviate from their average. Higher readings indicate larger price swings, while lower readings suggest calmer conditions.
Volatility analysis can help traders adjust position size and risk exposure, especially during uncertain market environments.
Average Directional Index (ADX)
While many indicators try to suggest where price might go next, the Average Directional Index takes a different approach. ADX focuses purely on how strong a trend is - not whether it’s up or down. A rising ADX reading generally signals that a trend is gaining traction, whereas a falling reading suggests momentum is fading and the market may drift sideways.
This makes ADX particularly useful as a filter. For example, traders who prefer trend-following strategies may wait for ADX to reach a certain level before entering, helping them avoid markets that lack direction. It’s worth remembering, though, that a strong trend can reverse suddenly, especially around major news or economic developments, so ADX is best used alongside other analysis rather than on its own.
.png/jcr:content/renditions/original-size.webp)
Quick fact
No indicator can predict markets with certainty - even widely used market indicators produce false signals, especially during volatile or news-driven conditions.
Which are the best indicators for day trading?
Intraday trading moves quickly, so tools that respond slowly to price changes are often less helpful. Day traders typically gravitate towards indicators that capture short-term momentum and immediate shifts in sentiment rather than long-term trends.
Short-term moving averages
Fast-reacting averages - particularly exponential moving averages - are commonly used to keep track of the market’s near-term direction. Traders may watch how price behaves around these lines during pullbacks or breakouts. Because they update rapidly, they can highlight subtle changes in momentum, although that speed also means they can fluctuate rapidly (whipsaw) in erratic conditions.
Momentum gauges
Oscillators such as RSI or stochastic indicators can provide a quick sense of whether buying or selling pressure is intensifying or easing. For intraday traders, this can help identify moments when a move looks stretched. However, strong trends can keep these readings elevated for longer than expected, so context always matters more than the number itself.
Volume as a reality check
Price movements backed by strong trading volume are often viewed as more meaningful than those occurring on thin activity. A sudden surge in volume can indicate broader participation, while declining volume may hint that a move is running out of steam. Many traders use volume simply as confirmation rather than as a standalone signal.
In practice, the “best” setup is usually a simple one that a trader understands well. Overcomplicating a chart rarely improves outcomes and can make fast decisions harder when markets are moving.
Ready to invest or trade with us?
Get started on the UK's number one platform
How to use technical indicators safely
Indicators can add structure to decision-making, but they shouldn’t replace judgement. Markets are influenced by a wide range of factors - economic data, central bank policy, political events and investor sentiment - none of which can be fully captured by a mathematical formula.
Start with the chart itself
Many experienced traders begin by assessing price action - identifying trends, ranges and key support or resistance levels - before layering indicators on top. This helps ensure the tools are supporting what the market is already showing, rather than dictating a trade idea in isolation.
Manage risk before chasing returns
No indicator can eliminate risk. Stop losses, position sizing and clear exit plans are essential, particularly when trading leveraged products where losses can accumulate quickly. Focusing on downside protection often matters more than finding the perfect entry. It should be noted, however, that stop losses may not always protect against all losses in fast-moving markets.
Practice in a low-pressure environment
Testing ideas on a demo account can reveal how indicators behave across different conditions without financial consequences (until, of course, you start live trading, and open yourself up to all of the associated risks). Strategies that look convincing in hindsight don’t always perform the same way in real time, especially during volatile periods.
Keep things simple
Using too many indicators at once can lead to analysis paralysis. When signals conflict, hesitation often follows - and hesitation can be costly in fast markets. A small number of well-understood tools is typically more effective than a crowded chart full of overlapping information.
Markets where traders commonly apply technical indicators
These markets have been chosen for their high liquidity and popularity among technical traders. They are not recommendations, and past performance is not an indicator of future results.
Technical traders frequently analyse the S&P 500 using indicators such as moving averages, RSI and MACD. The index tracks roughly 500 of the largest publicly listed US companies and is widely used as a benchmark for the broader US equity market.
The EUR/USD pair is another market commonly analysed using technical indicators. Because it is the most traded currency pair globally, its liquidity makes it a popular market for traders using technical analysis.
Individual shares are also frequently analysed using indicators. For example, Apple Inc. is one of the most actively traded stocks globally, and traders often apply indicators such as RSI or Bollinger Bands to assess momentum.
Risks of relying on trading indicators
Although indicators can help organise market data, they come with limitations that traders sometimes underestimate. Most importantly, they are derived from past prices. This means they react to what has already happened rather than anticipating future developments.
False signals are also common, particularly during sideways or highly volatile conditions. An indicator that performs well in trending markets may struggle when prices are range-bound, and vice versa. Overconfidence in a single tool can therefore lead to frequent trading without a clear edge.
External events present another challenge. Economic announcements, earnings reports or geopolitical developments can move markets sharply in ways no technical model could foresee. During such periods, indicators may lag behind reality or generate misleading readings.
Finally, there is behavioural risk. Indicators can create a false sense of certainty, encouraging traders to take larger positions or trade more often than they otherwise would. This is especially important when using leveraged instruments, where losses can exceed initial deposits.
For most market participants, indicators are best treated as aids to decision-making rather than decision-makers themselves. They are one piece of a broader approach that includes fundamental awareness, risk control and disciplined execution.
Once again, leveraged products such as CFDs carry a high risk of loss, and traders can lose more than their initial deposit.
Ready to get started?
Invest or trade with us here
Trading indicators summed up
- Trading indicators are tools used to analyse price trends and market behaviour
- There is no single “best” indicator - effectiveness depends on strategy and context
- Indicators should be combined with risk management and broader analysis
- Short-term traders often favour faster, momentum-based tools
- All trading involves risk, and losses can exceed deposits when using leverage
Important to know
This information has been prepared by IG, a trading name of IG Markets Limited. In addition to the disclaimer below, the material on this page does not contain a record of our trading prices, or an offer of, or solicitation for, a transaction in any financial instrument. IG accepts no responsibility for any use that may be made of these comments and for any consequences that result. No representation or warranty is given as to the accuracy or completeness of this information. Consequently any person acting on it does so entirely at their own risk. Any research provided does not have regard to the specific investment objectives, financial situation and needs of any specific person who may receive it. It has not been prepared in accordance with legal requirements designed to promote the independence of investment research and as such is considered to be a marketing communication. Although we are not specifically constrained from dealing ahead of our recommendations we do not seek to take advantage of them before they are provided to our clients. See full non-independent research disclaimer and quarterly summary.
Connect with us
Spread bets and CFDs are complex instruments and come with a high risk of losing money rapidly due to leverage. 68% of retail investor accounts lose money when trading spread bets and CFDs with this provider. You should consider whether you understand how spread bets and CFDs work and whether you can afford to take the high risk of losing your money.
Professional clients trading spread bets and CFDs can lose more than they deposit.
The value of shares, ETFs and other ETPs bought through a share dealing account, a stocks and shares ISA or a SIPP can fall as well as rise, which could mean getting back less than you originally put in. Past performance is no guarantee of future results. Some ETPs carry additional risks depending on how they’re structured, investors should ensure they familiarise themselves with the differences before investing.
Crypto - Don’t invest unless you’re prepared to lose all the money you invest. This is a high-risk investment, and you should not expect to be protected if something goes wrong. Take 2 mins to learn more.
Share dealing and IG Smart Portfolio accounts provided by IG Trading and Investments Ltd, CFD accounts are provided by IG Markets Ltd, spread betting provided by IG Index Ltd, cryptoassets services are provided by IG Digital Assets Ltd.
IG is a trading name of IG Trading and Investments Ltd (a company registered in England and Wales under number 11628764), IG Markets Ltd (a company registered in England and Wales under number 04008957) and IG Index Ltd (a company registered in England and Wales under number 01190902). Registered address at Cannon Bridge House, 25 Dowgate Hill, London EC4R 2YA. IG Markets Ltd (Register number 195355), IG Trading and Investments Ltd (Register Number 944492) and IG Index Ltd (Register number 114059) are authorised and regulated by the Financial Conduct Authority.
The information on this site isn’t directed at residents of the United States, Belgium or any particular country outside the UK and isn’t intended for distribution to, or use by, any person in any country or jurisdiction where such distribution or use would be contrary to local law or regulation.