Risk sentiments back to cautious mood: Russell 2000, ASX 200, AUD/JPY
Risk sentiments are back to cautious mood this week, having digested many of the big tech earnings and a series of uncertainties are now back onto the radar for the bulls to tackle.


Market Recap
Risk sentiments are back to a cautious mood this week, having digested many of the big tech earnings and a series of uncertainties are now back onto the radar for the bulls to tackle. Overnight, all three major US indices closed more than 1% lower, with safe-haven flows translating to a 1.6% jump in gold prices while Treasury yields plummet. This follows as the S&P 500 was back to retest its key 2023 high just this week, which may also draw some technical sellers in place.
A new low for the SPDR S&P Regional Banking ETF since November 2020 suggests that confidence in US regional banks has not been restored despite the First Republic Bank’s takeover, with lingering fears that there are some other troubled regional banks out there that has yet to be uncovered.
It could seem that a wider move from authorities could be warranted but any debate around a “blanket insurance” for banking deposits will likely drag on for longer, being seen as the last resort move from the Federal Deposit Insurance Corporation (FDIC). Thwarting gridlock in the US debt ceiling further adds to market stress as well, while a sharp decline in US job openings also saw indices reacting to the downside on heavy volume.
Ahead, the Federal Open Market Committee (FOMC) meeting will likely be the dominating theme for market trends. A 25 basis-point rate hike has been fully priced, so focus will be on how Federal Reserve (Fed) Chair Jerome Powell balance between keeping the Fed’s tightening option open and calming nerves around the renewed banking jitters.
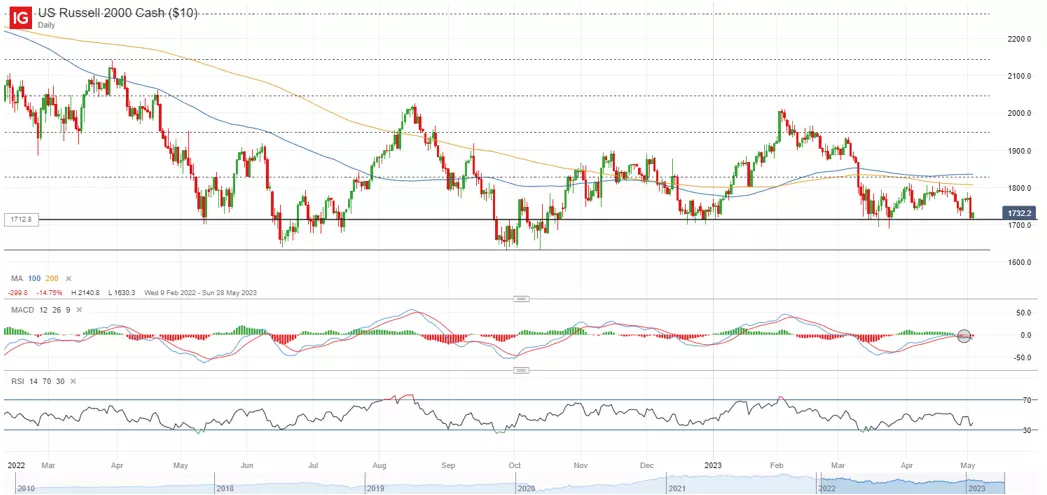
The Russell 2000 index is back to retest its 2023 low, with moderating upward momentum displayed on Moving Average Convergence/Divergence (MACD). Any formation of a new low ahead could leave the 1,630 level in sight. Longer term, it seems that the index remains stuck in a wider consolidation pattern, with the 1,630 level being a crucial support to hold.
Asia Open
Asian stocks look set for a negative open, with ASX -0.80% and KOSPI -0.61% at the time of writing (8.30 SGT). Japan markets are closed for holiday today. The surprise decision by the Reserve Bank of Australia (RBA) to resume its hiking process may serve as a reminder that the pace of moderation in inflation may matter. A 25 basis-point hike was delivered yesterday to raise its cash rate to 3.85%, along with a hawkish forward guidance which prompted a shift in market expectations to price for another rate hike in June.
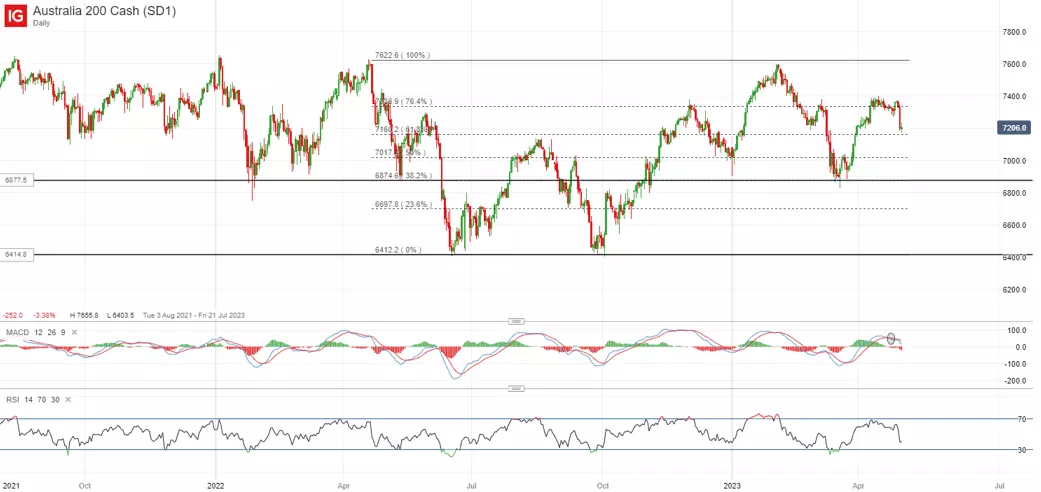
Tighter policies come with potential trade-off for growth, which was not well-received by the ASX 200 yesterday. Perhaps one to watch for the longer term will be any completion of a head-and-shoulder pattern, pending the formation of the right shoulder on further downside. Near term, the 7,130 level may be in focus, with any failure to hold potentially paving the way towards the key psychological 7,000 level next.
On the watchlist: Bearish shooting star rejection off 200-day MA for AUD/JPY
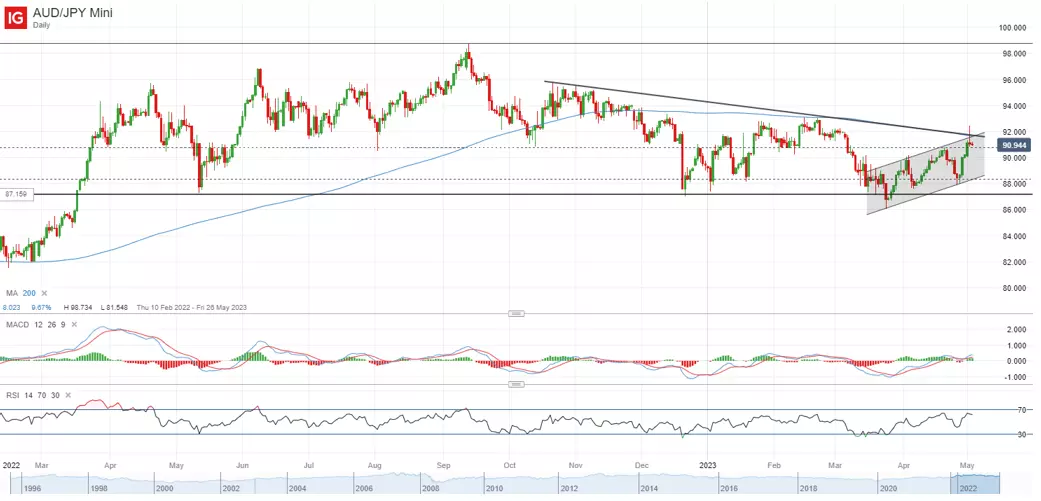
A 1.7% rally for the AUD/JPY in the aftermath of the RBA’s surprise hike eventually failed to sustain as risk-off flows seem to serve as a counter to further upside. For now, the formation of a bearish shooting star off its key 200-day moving average (MA) suggests the strong presence of sellers in keeping the overall trend down on lower highs, with the MA line serving as key resistance to the pair on at least three occasions.
Greater conviction for the bulls will have to come from a move back above the 200-day MA line. On the downside, a confirmation close below the 90.78 level could potentially be on watch to pave the way towards the 88.30 level next, where a lower channel trendline support resides.
Tuesday: DJIA -1.08%; S&P 500 -1.16%; Nasdaq -1.08%, DAX -1.23%, FTSE -1.24%
This information has been prepared by IG, a trading name of IG Markets Limited. In addition to the disclaimer below, the material on this page does not contain a record of our trading prices, or an offer of, or solicitation for, a transaction in any financial instrument. IG accepts no responsibility for any use that may be made of these comments and for any consequences that result. No representation or warranty is given as to the accuracy or completeness of this information. Consequently any person acting on it does so entirely at their own risk. Any research provided does not have regard to the specific investment objectives, financial situation and needs of any specific person who may receive it. It has not been prepared in accordance with legal requirements designed to promote the independence of investment research and as such is considered to be a marketing communication. Although we are not specifically constrained from dealing ahead of our recommendations we do not seek to take advantage of them before they are provided to our clients. See full non-independent research disclaimer and quarterly summary.

Act on share opportunities today
Go long or short on thousands of international stocks with spread bets and CFDs.
- Get full exposure for a comparatively small deposit
- Trade on spreads from just 0.1%
- Get greater order book visibility with direct market access
See opportunity on a stock?
Try a risk-free trade in your demo account, and see whether you’re on to something.
- Log in to your demo
- Take your position
- See whether your hunch pays off
See opportunity on a stock?
Don’t miss your chance – upgrade to a live account to take advantage.
- Trade a huge range of popular stocks
- Analyse and deal seamlessly on fast, intuitive charts
- See and react to breaking news in-platform
See opportunity on a stock?
Don’t miss your chance. Log in to take advantage while conditions prevail.
Live prices on most popular markets
- Equities
- Indices
- Forex
- Commodities
Prices above are subject to our website terms and agreements. Prices are indicative only. All share prices are delayed by at least 15 minutes.
Prices above are subject to our website terms and agreements. Prices are indicative only. All shares prices are delayed by at least 15 mins.