Is the price of oil set to fall to $60 a barrel?
Energy and economic analyst Osama Rizvi gives his outlook on the oil market with IGTV’s Angela Barnes. He predicts crude could fall to $60 a barrel by the end of 2023 and suggests ways for investors should position themselves.

(Partial video transcript)
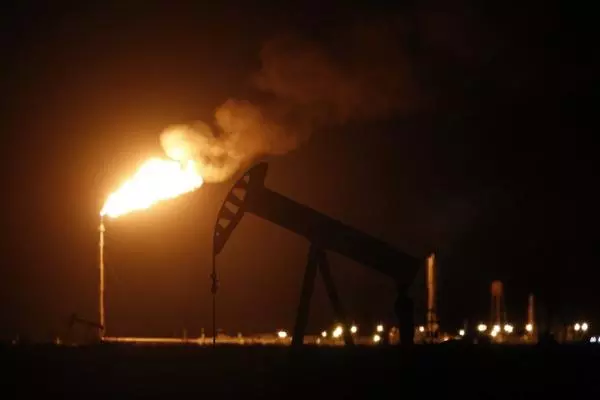
Getting the low-down on oil
Both Brent and US crude oil have been trading around the $80 to $85 a barrel level in August, although Brent hit $87 on 10 August and US crude also went up to $84 the same date, driven by increasing signs of a tightening market. However, demand concerns in China have also weighed on crude prices more recently, as investors consider the impact on oil in the world's second-largest economy.
AB: Let's go live now to energy and economic analyst Osama Rizvi in Lahore for more on this. Now, Osama, you are somebody who certainly keeps across the oil market, and there's a lot to go through at the moment, so I'm going to try and ask some of the questions that our investors and traders might be interested in.
Firstly, Osama, EIA weekly data showed on Wednesday that US oil production remained for a second week at 12.8 million barrels per day, which is the highest it's been since March 2020. Now, Baker Hughes' weekly oil rig count shows an almost constant decline in the number of oil and gas rigs in operation since the start of the year.
So, in numbers, producing US oil rigs in March 2020, around 680. Producing US oil rigs in August 2023 at 512, yet producing the same amount of crude oil. So, what do you make of this data, Osama?
OR: Thank you so much, Angela. I think it's a very interesting question, and you have to look at it from a different perspective. So, there are three or four main reasons for this. First of all, we all know that this year has been quite good for the big oil or the oil producers in that they registered record profits recently in the previous year. So, higher oil prices certainly have incentivised oil producers to produce more.
However, as you mentioned, this is happening with a reduced number of rigs, which is primarily because well productivity has gone up recently due to technological improvements, and also because of the recent learnings from the oil price war and how to keep afloat during the lower oil price time period. So, that is the first thing.
Secondly, drills, but uncompleted wells, the ducts, they have gone up. The number of ducts going up has also been one of the contributing factors to this. And thirdly, refracts. So, you know that there is a lot of focus right now on environmentally friendly technology and environmentally friendly ways, all the while keeping oil production and oil supply the same.
So, refracts come to the rescue, and the amount of refracts and the oil being recovered from refracts, those have also gone up. So, these are the four or five reasons primarily contributing to the increased or sustained oil supply, despite a fall in oil rigs.
Psychological $90 mark
AB: And, Osama, you and I have talked a lot about oil prices in the past. Is it going to hit $90 at times? Is it going to reach $100, go over $100? You know, my thoughts are that we're at this $80 to $85 a barrel level in August, as we were talking about as well. But what are your thoughts on oil prices in the short and the longer term?
OR: Well, Angela, you know that I have remained a bear throughout the start of this year. And I mean, I know there have been some spikes, some extraordinary swings to the upside in the oil prices. But we saw that despite this recent rally, oil prices failed to break the $90 psychological mark.
And now, so there is this physical market, and then there are paper markets. When you talk about fundamentals, and I'm going to talk about fundamentals for now, you see that all the fundamentals, all the major global economic indicators that are significant contributors to our perspective demand increase, they're all down. They're down to extraordinary levels.
This information has been prepared by IG, a trading name of IG Markets Limited. In addition to the disclaimer below, the material on this page does not contain a record of our trading prices, or an offer of, or solicitation for, a transaction in any financial instrument. IG accepts no responsibility for any use that may be made of these comments and for any consequences that result. No representation or warranty is given as to the accuracy or completeness of this information. Consequently any person acting on it does so entirely at their own risk. Any research provided does not have regard to the specific investment objectives, financial situation and needs of any specific person who may receive it. It has not been prepared in accordance with legal requirements designed to promote the independence of investment research and as such is considered to be a marketing communication. Although we are not specifically constrained from dealing ahead of our recommendations we do not seek to take advantage of them before they are provided to our clients. See full non-independent research disclaimer and quarterly summary.

React to volatility on commodity markets
Trade commodity futures, as well as 27 commodity markets with no fixed expiries.1
- Wide range of popular and niche metals, energies and softs
- Spreads from 0.3 pts on Spot Gold, 2 pts on Spot Silver and 2.8 pts on Oil
- View continuous charting, backdated for up to five years
1In the case of all DFBs, there is a fixed expiry at some point in the future.
See opportunity on a commodity?
Try a risk-free trade in your demo account, and see whether you’re onto something.
- Log in to your demo
- Try a risk-free trade
- See whether your hunch pays off
See opportunity on a commodity?
Don’t miss your chance. Upgrade to a live account to take advantage.
- Analyse and deal seamlessly on fast, intuitive charts
- Get spreads from just 0.3 points on Spot Gold
- See and react to breaking news in-platform
See opportunity on a commodity?
Don’t miss your chance. Log in to take your position.
Live prices on most popular markets
- Equities
- Indices
- Forex
- Commodities
Prices above are subject to our website terms and agreements. Prices are indicative only. All share prices are delayed by at least 15 minutes.
Prices above are subject to our website terms and agreements. Prices are indicative only. All shares prices are delayed by at least 15 mins.