Asia Day Ahead: US dollar attempt to stabilise, Nikkei 225 weaker ahead of BoJ meeting
The rally in Wall Street took a breather toward the end of last week, as Treasury yields attempted to stabilise following its negative reaction to the recent Federal Reserve’s (Fed) dovish rhetoric.


Market Recap
The rally in Wall Street took a breather toward the end of last week, as Treasury yields attempted to stabilise following its negative reaction to the recent Federal Reserve (Fed)'s dovish rhetoric. The US two-year yields rose slightly by 7 basis point (bp) while the 10-year yields were largely flat at 3.91%.
After feeding aggressive risk-on sentiments with their validation for rate cuts at the recent meeting, US policymakers are now trying to douse some rate-cut optimism, with New York Fed president John Williams and Atlanta’s Raphael Bostic seemingly guiding for a later timeline of cuts versus what interest rate markets were pricing. Above-target US inflation may drive some caution in policymakers’ verbal cues ahead, but a data-dependent Fed means there may be some shrugging off of Fed’s comments, with dovish bets remaining anchored for the first Fed rate cut as early as March next year.
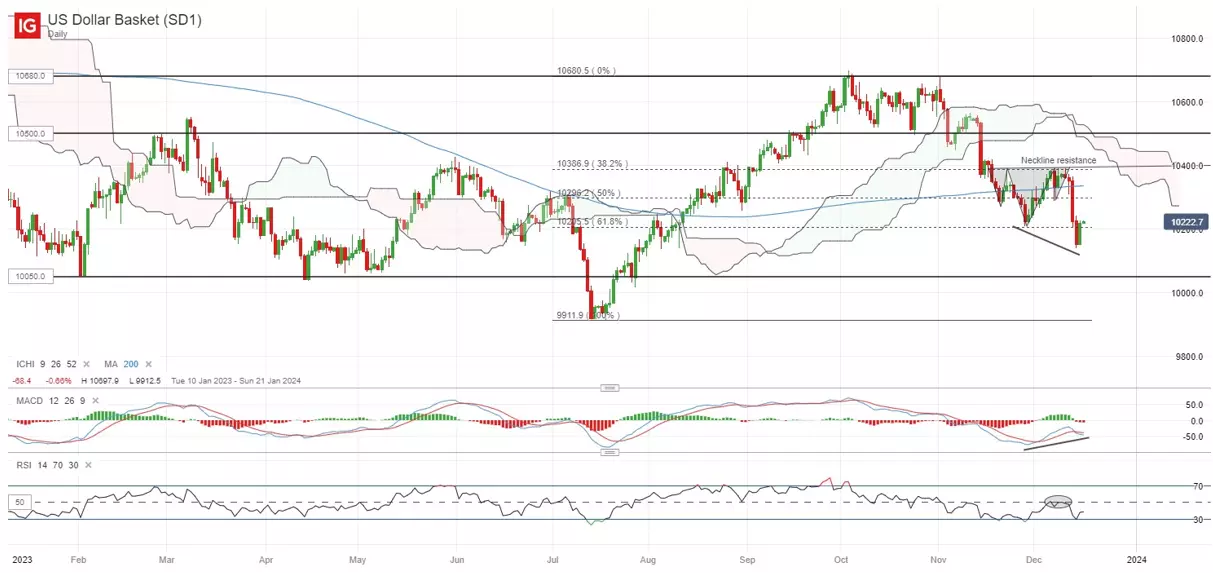
As we head into the new week, eyes will be on the Bank of Japan (BoJ) meeting on Tuesday, along with the Fed’s preferred measure of inflation, the US core Personal Consumption Expenditures (PCE) price index on Friday. Following the sharp sell-off post-Fed, there may be some attempt for the US dollar to stabilise, with the potential for a near-term bullish divergence on its daily moving average convergence/divergence (MACD). That said, the broader downward trend in the US dollar seems intact, with any upside potentially having to face heavy resistance at the 102.80 level.
Asia Open
Asian stocks look set for a negative open, with Nikkei -1.25%, ASX -0.32% and KOSPI -0.13% at the time of writing. Firmer short-dated Treasury yields, alongside some recovery in the US dollar, may prompt some profit-taking in today’s session, following the more subdued session in Wall Street last Friday.
The economic calendar saw the release of Singapore non-oil domestic exports (NODX) data for November, with its year-on-year growth reverting back into positive territory (1%) after a 13-month long contraction. Month-on-month, exports grew 0.3% versus the 0.2% consensus. Overall, the data may help to reflect some stabilisation in growth conditions, although global demand remain weak, particularly in electronic exports. Further recovery may be on the lookout over the coming months to provide further conviction that the worst may be over.
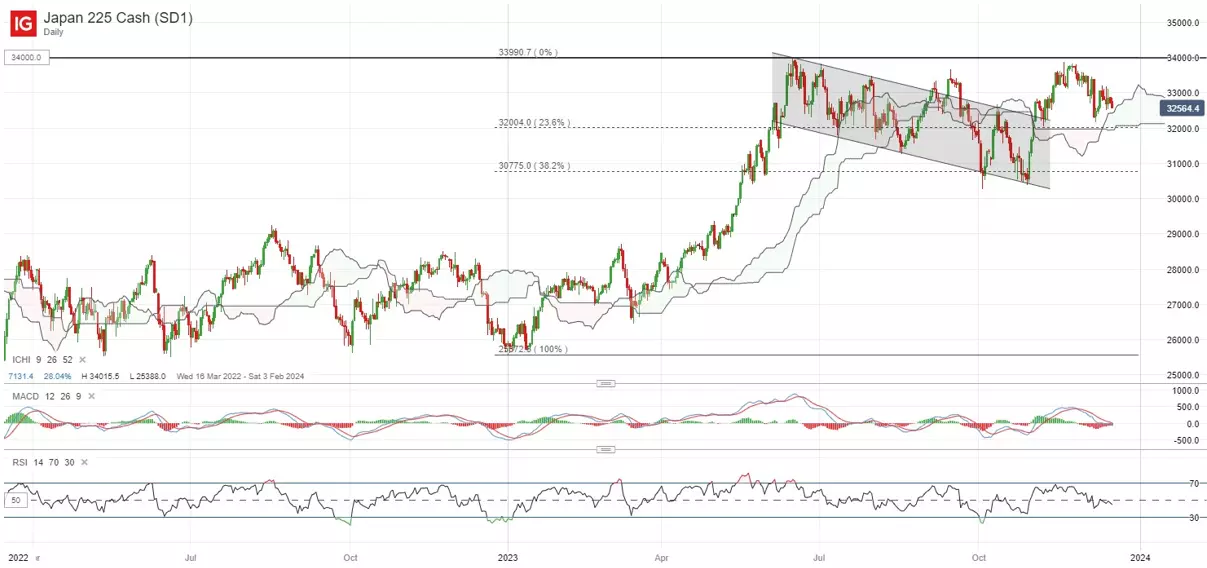
Ahead of the BoJ meeting, the Nikkei 225 index has been unwinding earlier gains after failing to deliver a fresh year-to-date high upon a retest last month. Broadly, the index remains stuck in a ranging pattern since June this year, with the key resistance at the 34,000 level proving to be a difficult one for buyers to overcome. On the downside, the 32,000 level may be a key support to hold, where the lower edge of its daily Ichimoku cloud stands. Failure to hold the 32,000 level may potentially see the index move to retest the 30,800 level next.
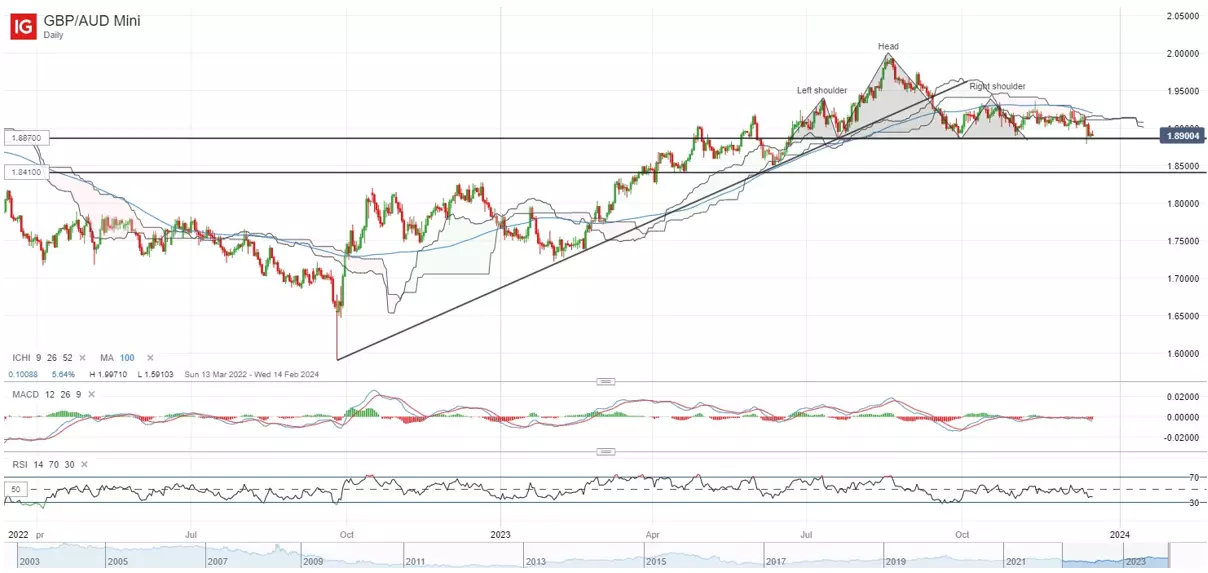
On the watchlist: GBP/AUD retesting head-and-shoulder neckline
After broadly trading on a near-term head-and-shoulder formation, the GBP/AUD is back to retest its neckline support at the 1.887 level last week. For now, the downward bias may remain as the pair struggles to reclaim its Ichimoku cloud on the daily chart ever since its breakdown in September 2023, while its daily relative strength index (RSI) continues to hang below the key 50 level. Any failure for the 1.887 level to hold ahead may pave the way for the pair to retest the 1.841 level next, while the head-and-shoulder formation breakdown may project an eventual price target at the 1.780 level.
Friday: DJIA +0.15%; S&P 500 -0.01%; Nasdaq +0.35%, DAX +0.00%, FTSE -0.95%
This information has been prepared by IG, a trading name of IG Markets Limited. In addition to the disclaimer below, the material on this page does not contain a record of our trading prices, or an offer of, or solicitation for, a transaction in any financial instrument. IG accepts no responsibility for any use that may be made of these comments and for any consequences that result. No representation or warranty is given as to the accuracy or completeness of this information. Consequently any person acting on it does so entirely at their own risk. Any research provided does not have regard to the specific investment objectives, financial situation and needs of any specific person who may receive it. It has not been prepared in accordance with legal requirements designed to promote the independence of investment research and as such is considered to be a marketing communication. Although we are not specifically constrained from dealing ahead of our recommendations we do not seek to take advantage of them before they are provided to our clients. See full non-independent research disclaimer and quarterly summary.

Act on share opportunities today
Go long or short on thousands of international stocks with spread bets and CFDs.
- Get full exposure for a comparatively small deposit
- Trade on spreads from just 0.1%
- Get greater order book visibility with direct market access
See opportunity on a stock?
Try a risk-free trade in your demo account, and see whether you’re on to something.
- Log in to your demo
- Take your position
- See whether your hunch pays off
See opportunity on a stock?
Don’t miss your chance – upgrade to a live account to take advantage.
- Trade a huge range of popular stocks
- Analyse and deal seamlessly on fast, intuitive charts
- See and react to breaking news in-platform
See opportunity on a stock?
Don’t miss your chance. Log in to take advantage while conditions prevail.
Live prices on most popular markets
- Equities
- Indices
- Forex
- Commodities
Prices above are subject to our website terms and agreements. Prices are indicative only. All share prices are delayed by at least 15 minutes.
Prices above are subject to our website terms and agreements. Prices are indicative only. All shares prices are delayed by at least 15 mins.