
Low cost
Our transparent fees are lower than traditional wealth managers, starting from just 0.50% and capped at £250 per year, per account type.
Simple, online process
Create your account in minutes. Simply answer a few questions to help us determine the best portfolio for you.
Managed by experts
Choose from a range of wealth portfolios, expertly managed by IG and designed by BlackRock – the world’s largest asset manager.
Tailored to you
Your investment is spread across shares, bonds and commodities to suit your needs and risk profile.
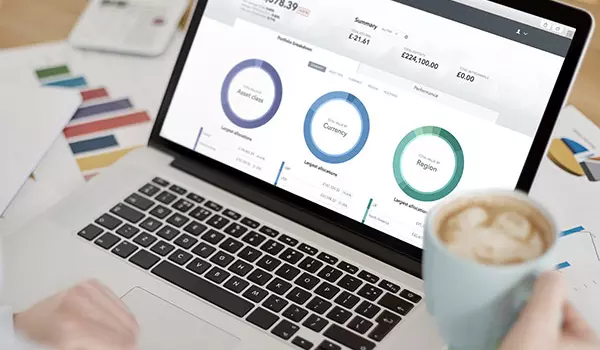
A smarter way to invest
IG Smart Portfolios are expertly managed, broadly diversified portfolios with exposure to many global markets, such as fixed income and equity, along with alternative investments like gold and property. At a fraction of the cost of traditional wealth managers, our portfolios are designed to help you reach your financial goals sooner.
Your portfolio will be built to suit your risk appetite – we’ll just ask you to answer a few questions about your needs.

How we diversify your exposure
IG Smart Portfolios are built exclusively with BlackRock’s iShares ETFs, which we believe are the perfect asset if you’re seeking long-term growth. Not only do ETFs have low fund charges, meaning you can keep more of your returns, but they also provide diverse market exposure to help minimise your investment risk.
Your portfolio will include ETFs that cover a range of asset classes and geographies, including:
- Government and investment-grade bonds
- Developed and emerging market equities
- Non-traditional assets such as gold and property
A globally diversified portfolio tailored to your investment goals. Actively managed and rebalanced by our expert investment team, in partnership with BlackRock, to keep performance in line with your goals.

A fraction of the cost
IG Smart Portfolios offer you an affordable and innovative way to invest. All the costs involved in our low fee structure are fully transparent, and our commitment to clarity on charges means you’ll know the total cost of ownership (TCO) before you invest.
We offer this information upfront because we understand the difficulty in comparing costs between providers. Some simply offer a different type of service, while others don’t allow you to view your total costs unless you become a customer.
You can see a complete breakdown of costs for an IG Smart Portfolio in the table below. Discover how our total annual cost, on a £40,000 investment, compares with providers offering a similar type of discretionary investment management service.
|
Management fee |
Fund costs2 |
Transaction costs3 |
Est. total annual cost (%) |
Est. total annual cost (£) |
| IG Smart Portfolio | 0.50% | 0.13% | 0.09% | 0.72% | £288 |
| Wealthify | 0.60% | 0.16% | 0.00% | 0.76% | £328 |
| Moneyfarm | 0.75%* | 0.20% | 0.09% | 1.04% | £371 |
| Nutmeg | 0.75% | 0.19% | 0.07% | 1.01% | £400 |
This table contains latest available data from the websites of each provider. Data accurate as of May 2024.
* For the first £10,000. Tiered distribution after
Your IG Smart Portfolio will be managed free of charge if it exceeds £50,000, effectively capping your management fee at £250 a year. This means that as your investments grow, the average cost for your portfolio falls.
Online wealth management expertise
We created IG Smart Portfolios using iShares ETFs from BlackRock – the world’s largest asset manager, with over $6 trillion under management. We’ve tailored each of our offerings according to a defined level of risk – enabling you to choose from a range of expertly designed portfolios to suit your needs and risk appetite.
Using BlackRock’s cutting-edge investment research, we regularly rebalance our portfolios as market conditions change. This ensures that you have the optimal asset allocation for your risk profile.
Our relationship with BlackRock
We are responsible for constructing and managing your IG Smart Portfolio. Our decisions are based on asset allocation insights from BlackRock, which enable us to provide institutional-quality portfolios that cater to five distinct risk profiles.
The asset allocation insights from BlackRock are supported by Aladdin, BlackRock’s proprietary portfolio risk management platform. Aladdin is licensed by more than 200 external organisations, including some of the world’s largest financial institutions, and is used to analyse over $21.6 trillion of assets (as of February 2020).
By combining BlackRock’s asset allocation insights with our cutting-edge technology and expert customer service, IG Smart Portfolios can provide a better investment solution.
Performance
We believe that the combination of BlackRock’s investment management services, our technology and low costs puts us in a strong position to deliver impressive investment results.
We now have six years of performance data and the chart below shows average annual returns for each Smart Portfolio since these were launched in February 2017.
Remember, the value of investments can fall as well as rise, and you may get back less than you invested. Past performance is no guarantee of future results.
A full performance breakdown for each portfolio and its benchmark can be seen below.
- Aggressive
- Growth
- Balanced
- Moderate
- Conservative
|
2017 |
2018 |
2019 |
2020 |
2021 |
2022 |
2023 |
2024 |
Last 12 Months |
Last 5 Years |
All Time* |
Annualised |
| Aggressive | 8.5% | -6.5% | 19.4% | 10.9% | 18.2% | -12.2% | 12.5% | 14.0% | 12.3% | 59.1% | 81.8% | 7.8% |
| Benchmark | 7.9% | -6.5% | 18.0% | 5.8% | 12.3% | -11.4% | 8.3% | 9.3% | 9.0% | 36.6% | 51.2% | 5.3% |
| Difference | 0.5% | 0.0% | 1.3% | 5.1% | 5.9% | -0.8% | 4.2% | 4.7% | 3.4% | 22.4% | 30.6% | 2.5% |
*Part year. The Aggressive Smart Portfolio has performance data from 28 Feb 2017.
|
2017 |
2018 |
2019 |
2020 |
2021 |
2022 |
2023 |
2024 |
Last 12 Months |
Last 5 Years |
All Time* |
Annualised |
| Growth | 10.7% | -5.6% | 17.0% | 11.4% | 13.5% | -11.9% | 10.8% | 11.3% | 11.0% | 45.8% | 115.8% | 7.5% |
| Benchmark | 9.4% | -5.6% | 15.0% | 4.6% | 10.2% | -10.2% | 7.2% | 7.9% | 8.4% | 29.4% | 70.4% | 5.2% |
| Difference | 1.3% | 0.0% | 2.0% | 6.9% | 3.2% | -1.7% | 3.6% | 3.5% | 2.6% | 16.5% | 45.4% | 2.4% |
|
2017 |
2018 |
2019 |
2020 |
2021 |
2022 |
2023 |
2024 |
Last 12 Months |
Last 5 Years |
All Time* |
Annualised |
| Balanced | 8.1% | -4.6% | 14.1% | 9.2% | 8.8% | -11.4% | 8.9% | 8.7% | 9.5% | 30.3% | 82.5% | 5.9% |
| Benchmark | 6.7% | -5.1% | 11.7% | 4.3% | 7.6% | -9.1% | 5.8% | 6.4% | 7.6% | 22.0% | 50.4% | 3.9% |
| Difference | 1.4% | 0.5% | 2.3% | 4.8% | 1.1% | -2.3% | 3.2% | 2.3% | 1.9% | 8.3% | 32.1% | 1.9% |
|
2017 |
2018 |
2019 |
2020 |
2021 |
2022 |
2023 |
2024 |
Last 12 Months |
Last 5 Years |
All Time* |
Annualised |
| Moderate | 4.5% | -3.6% | 10.0% | 7.4% | 3.4% | -9.4% | 6.0% | 5.0% | 7.1% | 14.5% | 49.3% | 3.9% |
| Benchmark | 4.5% | -3.6% | 8.1% | 4.2% | 4.2% | -7.6% | 3.7% | 4.6% | 6.1% | 12.8% | 31.4% | 2.6% |
| Difference | 0.0% | 0.0% | 1.9% | 3.2% | -0.8% | -1.8% | 2.3% | 0.4% | 1.0% | 1.7% | 17.9% | 1.2% |
|
2017 |
2018 |
2019 |
2020 |
2021 |
2022 |
2023 |
2024 |
Last 12 Months |
Last 5 Years |
All Time* |
Annualised |
| Conservative | 0.3% | -0.9% | 3.6% | 2.0% | -0.4% | -5.6% | 4.3% | 3.6% | 5.2% | 4.3% | 19.1% | 1.7% |
| Benchmark | 1.3% | 1.6% | 1.7% | 1.1% | 1.1% | 2.2% | 5.6% | 6.1% | 6.0% | 17.9% | 27.9% | 2.3% |
| Difference | -1.0% | -2.5% | 1.9% | 0.9% | -1.4% | -7.8% | -1.3% | -2.5% | -0.8% | -13.6% | -8.7% | -0.7% |
Choose the best account for you
We offer three types of IG Smart Portfolio. You can have as many portfolios as you like, or any combination of each, which means you get complete flexibility over how you organise your investments.
General investment
A standard investment account, where gains and dividends are taxable.
This account type is useful if you’ve already filled your stocks and shares ISA.
ISA
Use your £20,000 ISA allowance so that your investment gains and the dividends you receive are all tax-free.
Your ISA allowance resets at the start of the tax year.
How it works
We ask about you
Whether you’re saving for retirement, school fees or just simply looking for a better return on your savings, we’ll tailor your portfolio to you. Just answer a few simple questions about your investment goals, and we’ll get you up and running.
We build your portfolio
After we’ve learnt about your investing goals, we’ll show you the portfolio with the best mix of investments to meet your targets.
See how we expect each portfolio to perform over time, and you can easily change which one to invest in.
Deposit your funds
Whether you’re saving for retirement, school fees or just simply looking for a better return on your savings, we’ll tailor your portfolio to you. Just answer a few simple questions about your investment goals, and we’ll get you up and running.
Top up at any time
Add funds to your investment whenever you like – you can even set up a standing order to do it automatically. Meanwhile, we’ll rebalance your portfolio as needed, so you don’t have to.
Check up on your portfolio
See how your portfolio is performing at any time on our intuitive online platform or mobile app. You can also switch between portfolios or withdraw your money without charge. Simple.
Open an account now
Open an account now
Fast execution on a huge range of markets
Enjoy flexible access to 15,000+ global markets, with reliable execution
Deal seamlessly, wherever you are
Trade on the move with our natively designed, award-winning trading app
Feel secure with a trusted provider
With 50 years of experience, we’re proud to offer a truly market-leading service

Open an account now
Open an account now
Fast execution on a huge range of markets
Enjoy flexible access to 15,000+ global markets, with reliable execution
Deal seamlessly, wherever you are
Trade on the move with our natively designed, award-winning trading app
Feel secure with a trusted provider
With 50 years of experience, we’re proud to offer a truly market-leading service

Start trading now
Log in to your account now to access today’s opportunity in a huge range of markets.
Start trading now
Log in to your account now to access today’s opportunity in a huge range of markets.
Get your free beginner's guide to investing
- Discover the benefits of investing your money
- Learn about the different investment options available and how to get started
- Understand how to build a diversified portfolio and manage your risk

FAQs
Who chooses what goes into my portfolios?
All five portfolios are based on models that are managed by BlackRock. BlackRock assets under management now $10 trillion. We created our partnership to give everyday investors the opportunity to invest in their expertly managed portfolios.
We power the technology behind your investments. From our platform, which lets you monitor your investments at all times, to our state-of-the-art dealing technology, which makes sure your cash is invested up to the nearest pound, we’re continuously looking for ways to improve your experience. Plus, our customer service team is on hand to help with any questions you have, 24 hours a day.
Can I have an IG Smart Portfolio ISA as well as an IG share dealing ISA?
Yes, our ISA account is designed to be flexible, so you can invest some of your ISA allowance in a Smart Portfolio and some in a share dealing account. You can move cash freely between each account type. If you withdraw funds, you have until the end of the tax year to add the cash back in, or you’ll risk losing out on your annual ISA allowance.
Can I withdraw my money at any time, at no cost?
Yes, and yes. While many wealth management companies will only allow you to buy or sell your investments at one point in the day, we have the technology to let you buy, sell or switch portfolio immediately, at any time. We don’t charge transaction fees for buying or selling, and we’ll never charge you for withdrawing your cash.
Do you offer junior ISAs?
No, we don’t currently offer junior ISAs.
2 The Total Expense Ratio (TER) for the ETFs in an IG Smart Portfolio is subject to your portfolio allocation and is currently between 0.11% and 0.14%. Correct as at 6 May 2021.
3 Source: www.theinvestmentassociation.org
Connect with us
Spread bets and CFDs are complex instruments and come with a high risk of losing money rapidly due to leverage. 68% of retail investor accounts lose money when trading spread bets and CFDs with this provider. You should consider whether you understand how spread bets and CFDs work and whether you can afford to take the high risk of losing your money.
Professional clients trading spread bets and CFDs can lose more than they deposit.
The value of shares, ETFs and other ETPs bought through a share dealing account, a stocks and shares ISA or a SIPP can fall as well as rise, which could mean getting back less than you originally put in. Past performance is no guarantee of future results. Some ETPs carry additional risks depending on how they’re structured, investors should ensure they familiarise themselves with the differences before investing.
Crypto - Don’t invest unless you’re prepared to lose all the money you invest. This is a high-risk investment, and you should not expect to be protected if something goes wrong. Take 2 mins to learn more.
Share dealing and IG Smart Portfolio accounts provided by IG Trading and Investments Ltd, CFD accounts and futures accounts are provided by IG Markets Ltd, spread betting provided by IG Index Ltd.
IG is a trading name of IG Trading and Investments Ltd (a company registered in England and Wales under number 11628764), IG Markets Ltd (a company registered in England and Wales under number 04008957) and IG Index Ltd (a company registered in England and Wales under number 01190902). Registered address at Cannon Bridge House, 25 Dowgate Hill, London EC4R 2YA. IG Markets Ltd (Register number 195355), IG Trading and Investments Ltd (Register Number 944492) and IG Index Ltd (Register number 114059) are authorised and regulated by the Financial Conduct Authority.
The information on this site isn’t directed at residents of the United States, Belgium or any particular country outside the UK and isn’t intended for distribution to, or use by, any person in any country or jurisdiction where such distribution or use would be contrary to local law or regulation.