Four scalping trading strategies
We look at scalping trading strategies, and some indicators that can prove useful.


What is scalping?
Scalping is a trading strategy designed to profit from small price changes, with profits on these trades taken quickly and once a trade has become profitable. All forms of trading require discipline, but because the number of trades is so large, and the gains from each individual trade so small, a scalper must have a rigid adherence to their trading system, avoiding one large loss that could wipe out dozens of successful trades.
Scalpers will take many small profits, and not run any winners, in order to seize gains as and when they appear. The aim is for a successful trading strategy through the large number of winners, rather than a few successful trades with large winning sizes.
Scalping relies on the idea of lower exposure risk, since the actual time in the market on each trade is quite small, lessening the risk of an adverse event causing a big move. In addition, it takes the view that smaller moves are easier to get than larger ones, and that smaller moves are more frequent than larger ones.
Best scalping strategies
Scalp trading using the stochastic oscillator
Scalping can be accomplished using a stochastic oscillator. The term stochastic relates to the point of the current price in relation to its range over a recent period of time. By comparing the price of a security to its recent range, a stochastic attempts to provide potential turning points.
Scalping with the use of such an oscillator aims to capture moves in trending market, ie: one that is moving up or down in a consistent fashion. Prices tend to close near the extremes of the recent range before a turning point occurs, such an example is seen below:
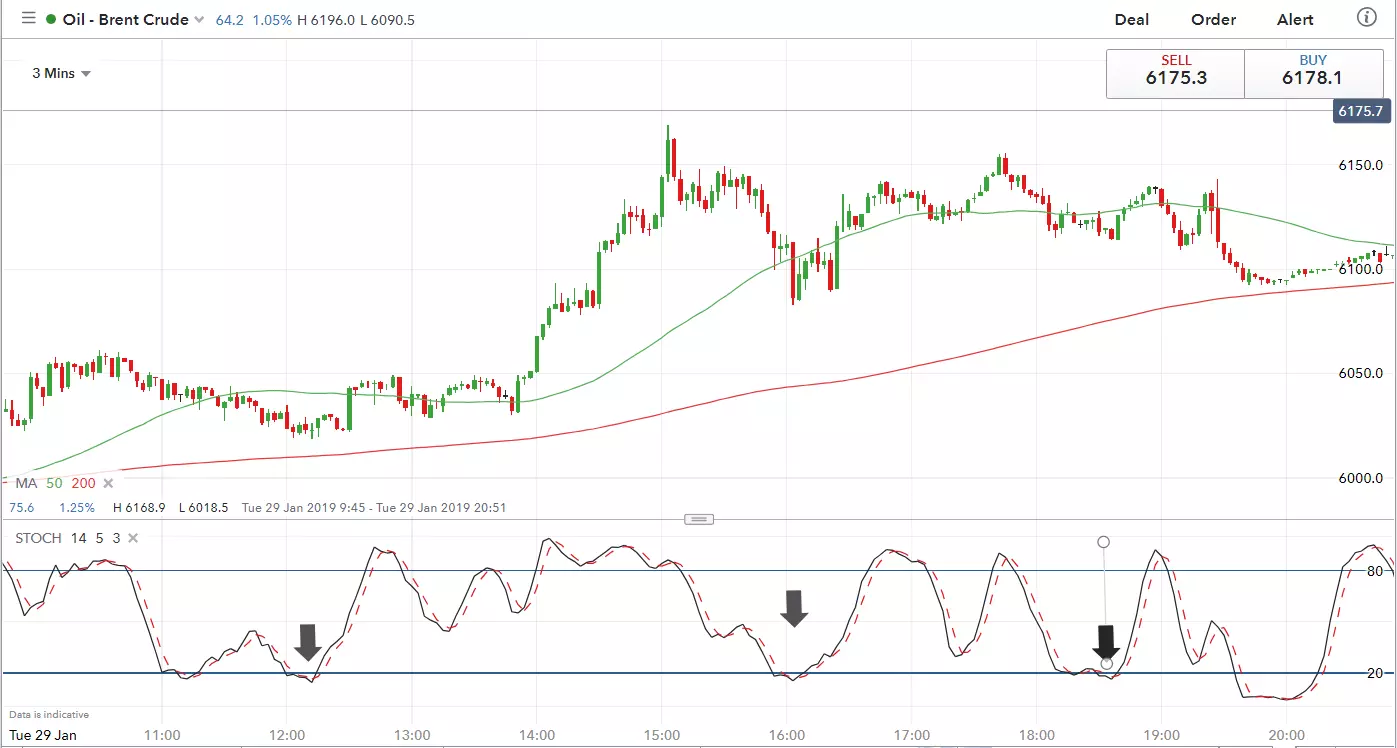
In the above chart, of Brent on a three minute timeframe, we can see that the price is moving higher, and the lows in the stochastics (marked with arrows) provide entry points for long trades, when the black %K line crosses above the dotted red %D line. The trade is exited when the stochastic reaches the top end of its range, above 80, or when the bearish crossover appears, when the %K line crosses below %D.
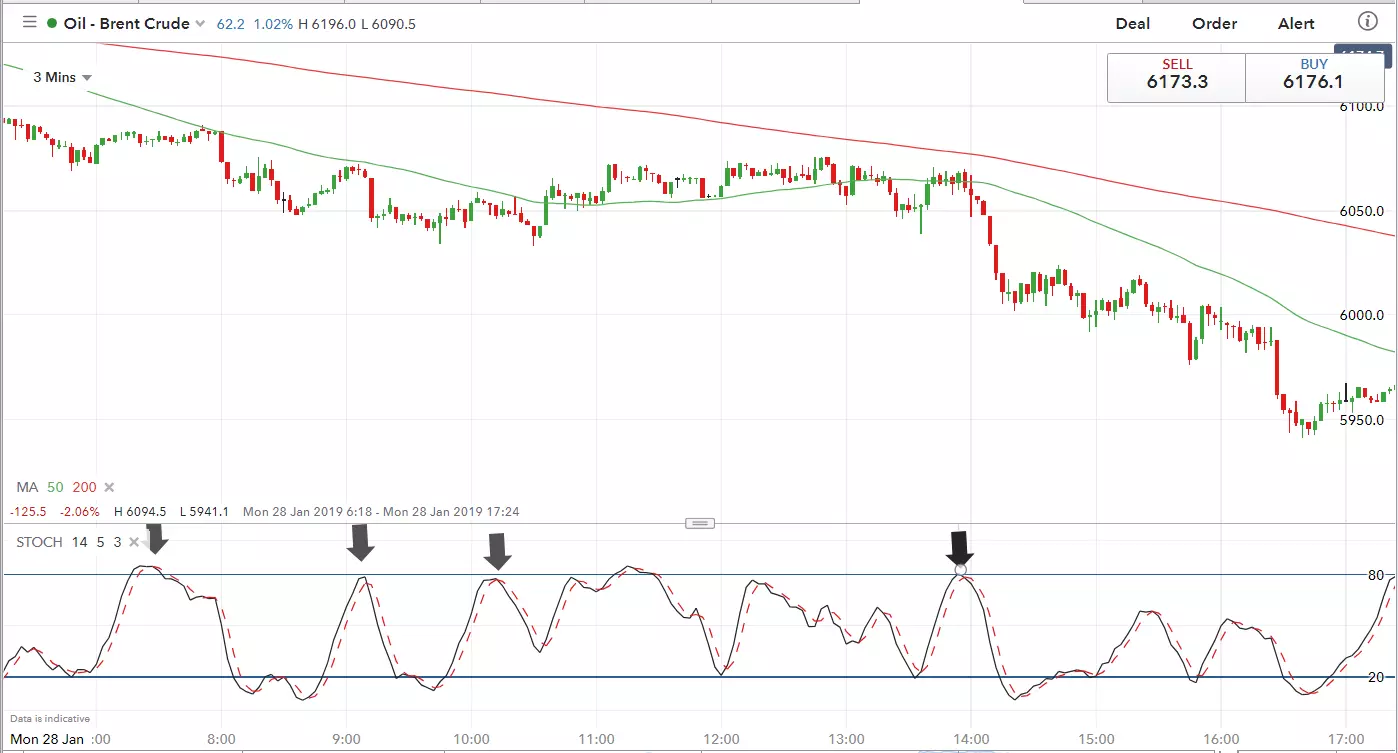
By contrast, short positions would be used in a downward trending market, with an example below. This time, instead of ‘buying the dips’, we are ‘selling the rallies’. So we will look for bearish crossovers in the direction of the trend, as highlighted below:
Scalp trading using the moving average
Another method is to use moving averages, usually with two relatively short-term ones and a much longer one to indicate the trend.
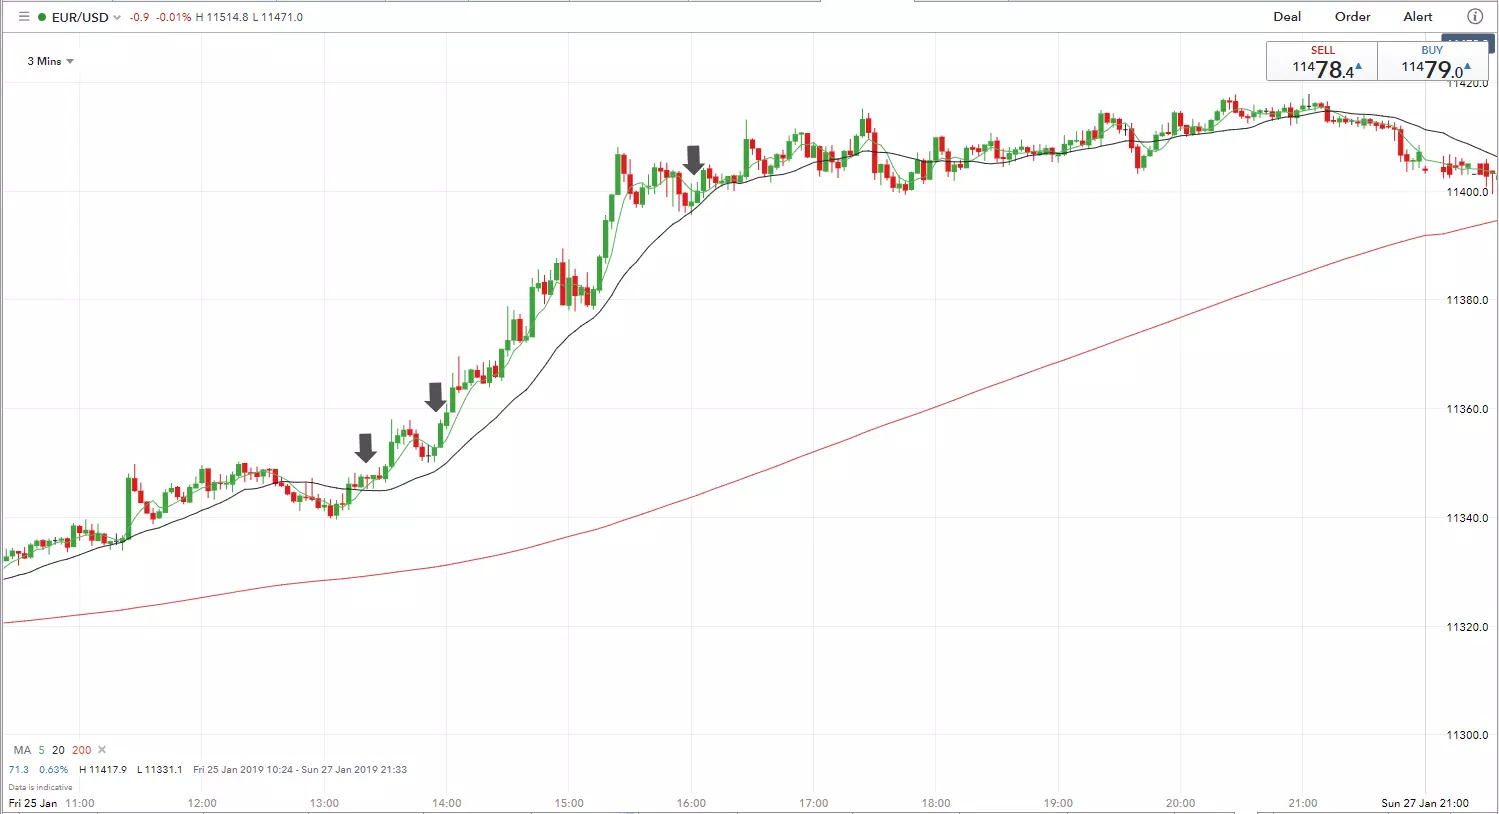
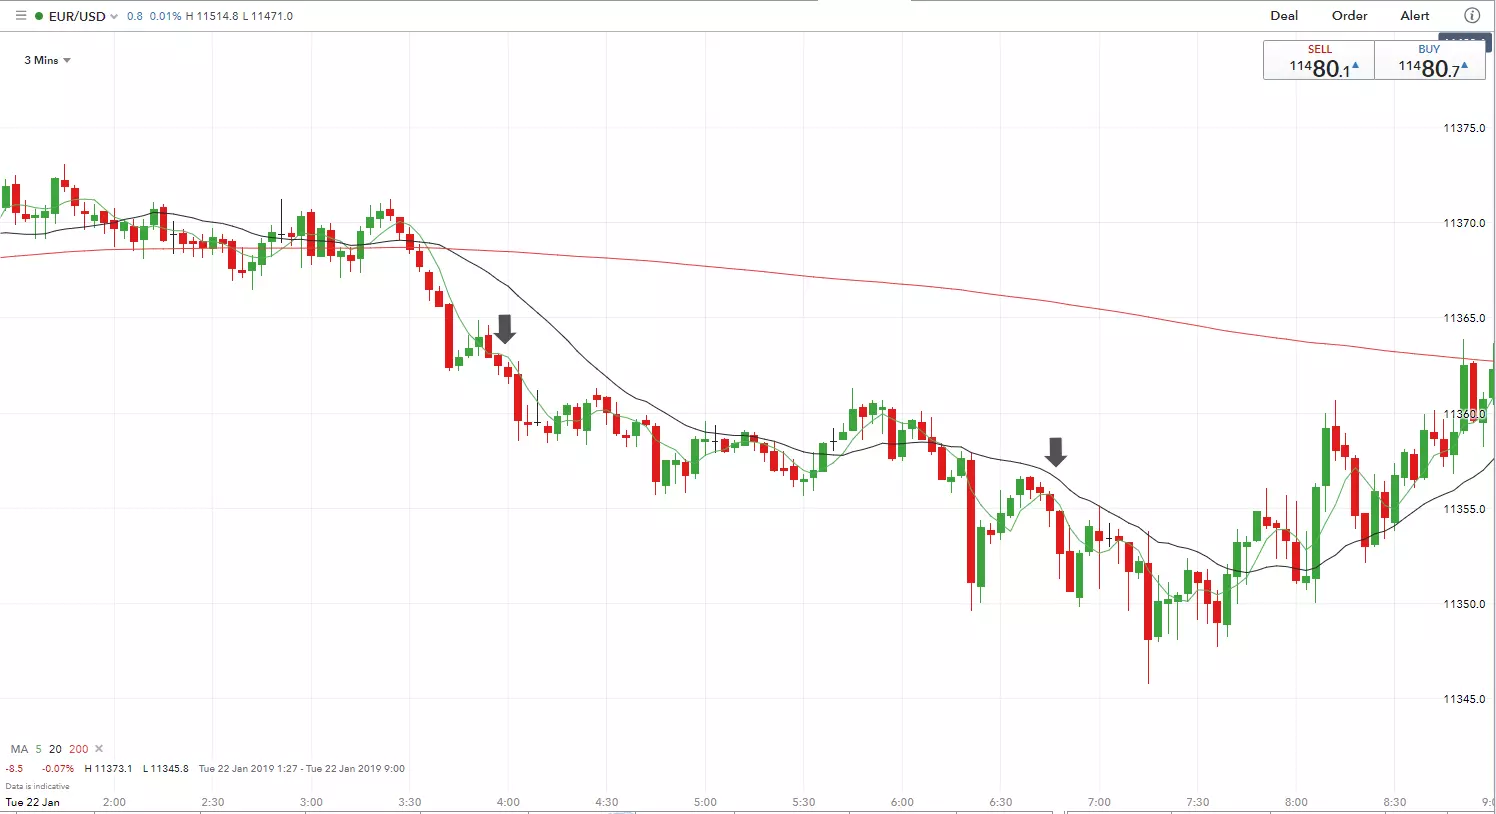
In the examples below, on a three minute EUR/USD chart, we are using five and 20-period moving averages (MA) for the short term, and a 200-period MA for the longer term. In the first chart the longer-term MA is rising, so we look for the five period MA to cross above the 20 period, and then take positions in the direction of the trend. These are marked with an arrow.
In the second example, the long-term MA is declining, so we look for short positions when the price crosses below the five-period MA, which has already crossed below the 20-period MA.
It is important to remember that these trades go with the trend, and that we are not looking to try and catch every move. As in all scalping, correct risk management is essential, with stops vital in order to avoid larger losses that quickly erase many small winners.
Scalp trading using the parabolic SAR indicator
The parabolic SAR is an indicator that highlights the direction in which a market is moving, and also attempts to provide entry and exit points. SAR stands for ‘stop and reversal’. The indicator is a series of dots placed above or below the price bars. A dot below the price is bullish, and one above is bearish.
A change in the position of the dots suggests that a change in trend is underway.
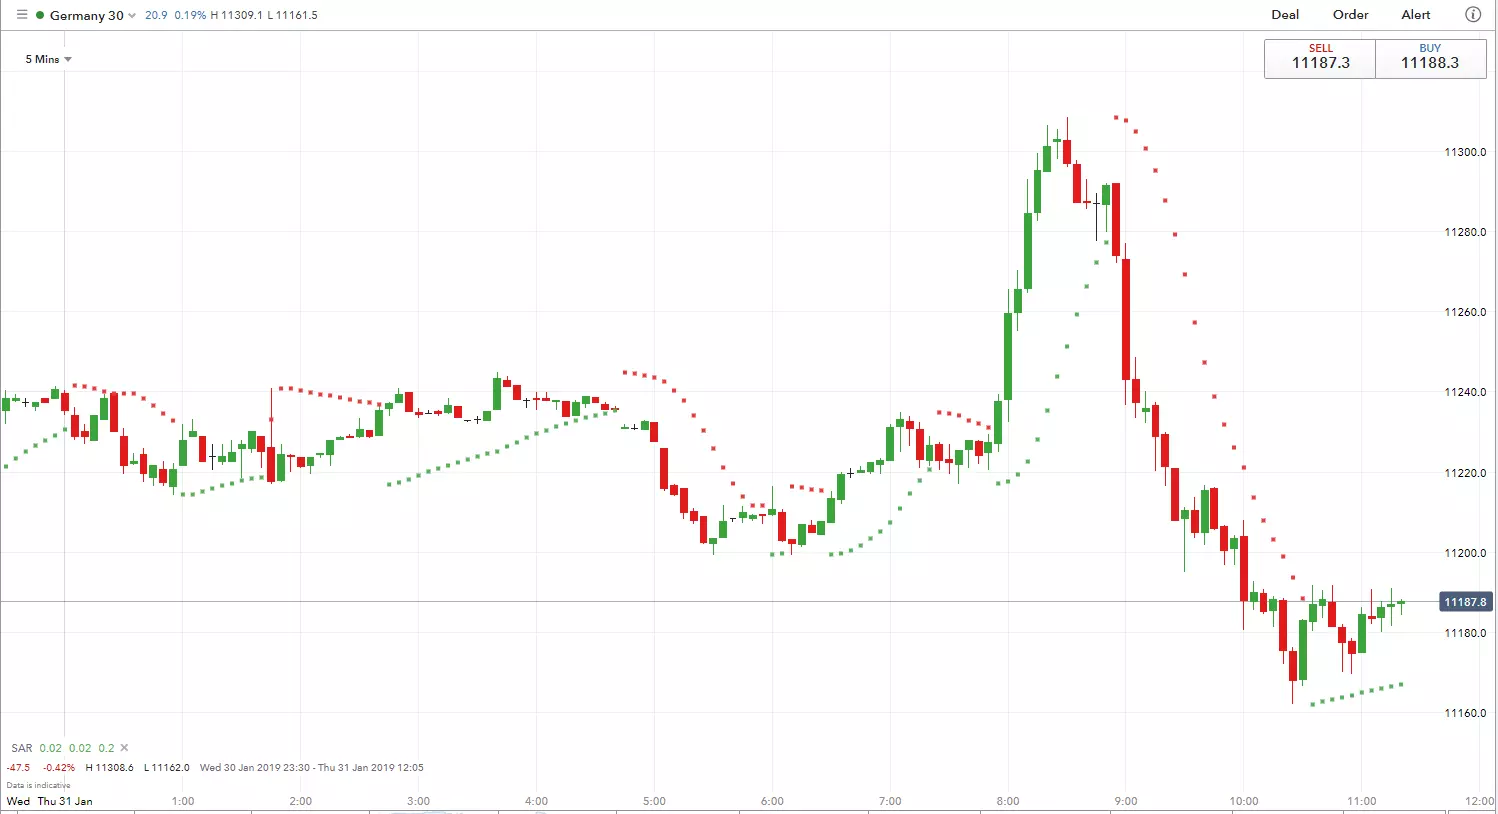
The chart below shows the DAX on a five minute chart; short trades can be taken when the price moves below the SAR dots, and longs when the price is above them. As can be seen, some trends are quite extended, and at other times a trader will face lots of losing trades.
Scalp trading using the RSI
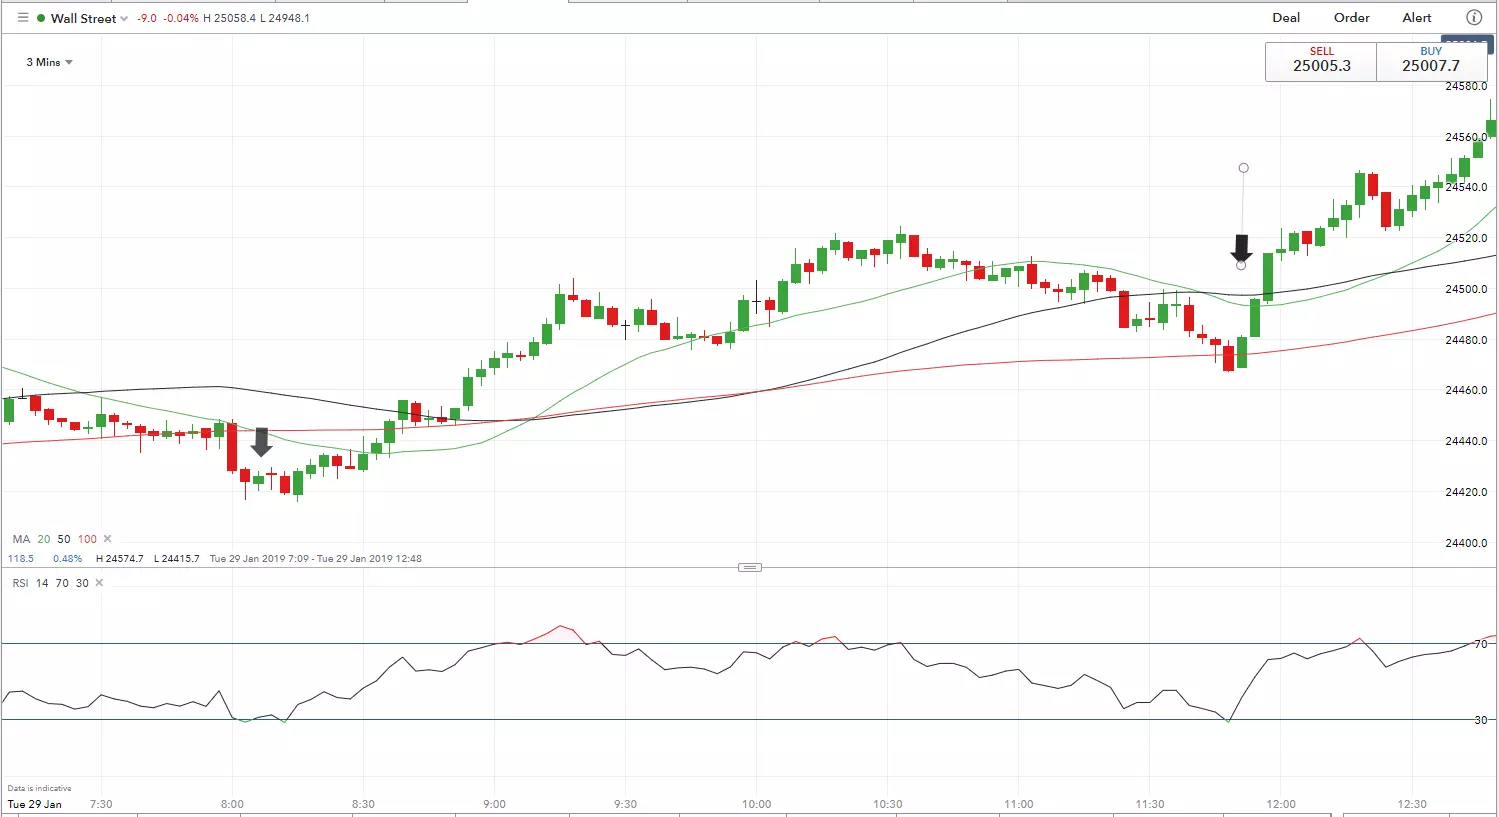
Finally, traders can use the RSI to find entry points that go with the prevailing trend. In the first example, the price is moving steadily higher, with the three moving averages broadly pointing higher.
Dips in the trend are to be bought, so when the RSI drops to 30 and then moves above this line, a possible entry point is created.
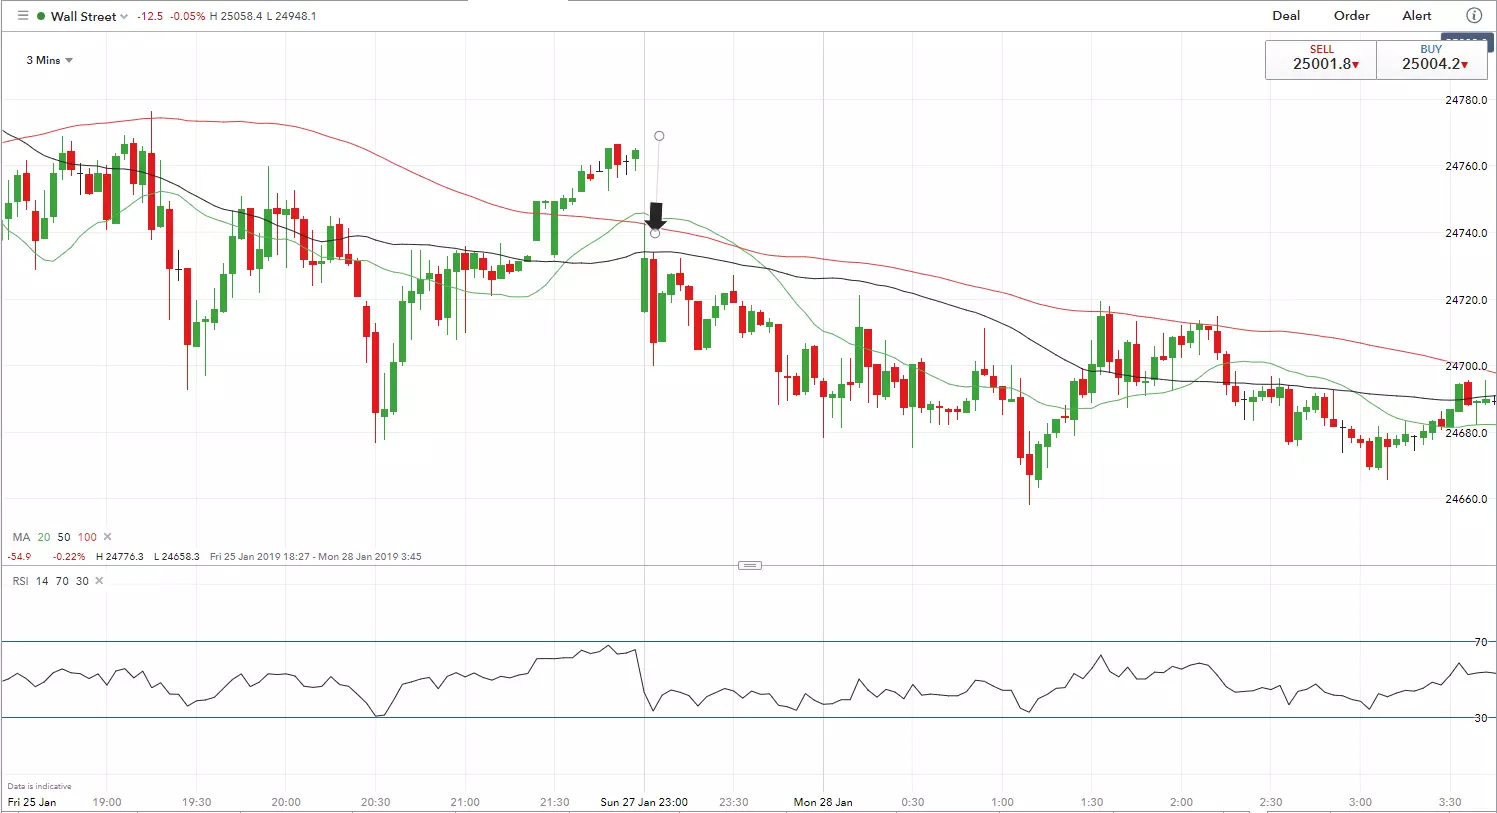
By contrast, when the RSI moves to 70 and then begins to decline within a downtrend, a chance to ‘sell the rally’ is created, as we have seen in the example below.
What you need to know before scalping
Scalping requires a trader to have iron discipline, but it is also very demanding in terms of time. While longer-term time frames and smaller sizes allow traders to step away from their platforms, since possible entries are fewer and can be monitored from a distance, scalping demands a trader’s full attention.
Possible entry points can appear and disappear very quickly, and thus, a trader must remain tied to his platform. For individuals with day jobs and other activities, scalping is not necessarily an ideal strategy. Instead, longer-term trades with bigger profit targets are more suited.
Scalping is a difficult strategy to execute successfully. One of the primary reasons is that it requires many trades over the course of time. Research on this subject tends to show that more frequent traders merely lose money more quickly, and have a negative equity curve. Instead, most traders would find more success, and reduce their time commitments to trading, and even cut down on stress, by looking for long-term trades and avoid scalping strategies.
Scalping requires quick responses to market movements and an ability to forgo a trade if the exact moment is missed. ‘Chasing’ trades, along with a lack of stop loss discipline, are the key reasons that scalpers are often unsuccessful. The idea of only being in the market for a short period of time sounds attractive, but the chances of being stopped out on a sudden move that quickly reverses is high.
Trading is an activity that rewards patience and discipline. While those successful in scalping do demonstrate these qualities, they are a small number. Most traders are better off with a longer-term view, smaller position sizes and a less frenetic pace of activity.
This information has been prepared by IG, a trading name of IG Markets Limited. In addition to the disclaimer below, the material on this page does not contain a record of our trading prices, or an offer of, or solicitation for, a transaction in any financial instrument. IG accepts no responsibility for any use that may be made of these comments and for any consequences that result. No representation or warranty is given as to the accuracy or completeness of this information. Consequently any person acting on it does so entirely at their own risk. Any research provided does not have regard to the specific investment objectives, financial situation and needs of any specific person who may receive it. It has not been prepared in accordance with legal requirements designed to promote the independence of investment research and as such is considered to be a marketing communication. Although we are not specifically constrained from dealing ahead of our recommendations we do not seek to take advantage of them before they are provided to our clients. See full non-independent research disclaimer and quarterly summary.

Discover how to trade the markets
Explore the range of markets you can trade – and learn how they work – with IG Academy's free ’introducing the financial markets’ course.