Is copper on its way to 8,000?
With the softening of Chinese economic data, base metals have been finding the going tough.

The recent short trade in copper has been working out well and, as IGTV’s Jeremy Naylor says, technically there is still some distance to go before hitting the psychologically important $8,000 mark.
(Video Transcript)
Copper
One of the trade ideas we've been floating around in the markets recently around the early morning call where we take a look at how the European markets are opening and we've been following an interesting trade around Copper. Now copper is very sensitive to what's going on in China.
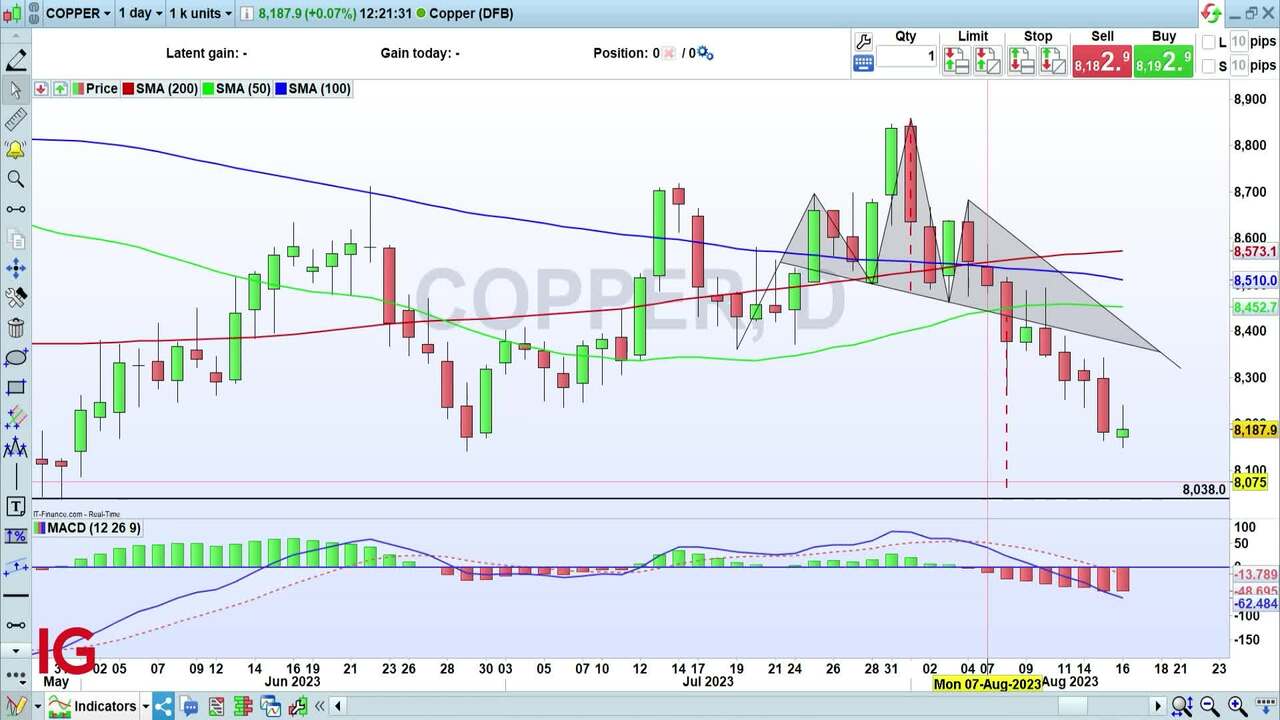
We know from all the evidence we're seeing across the board in terms of the economic data to suggest that China is slowing down. It's a degree of slowdown I think in some areas and in fact it's quite speedy in other areas such as the property market for example at the moment. And concerns are that we will see China continue to see softening growth and possibly deflation as well and as a result of all this we're seeing prices of some of those base metals on the way down. I want to show you the chart of Copper just so you get a basic idea as to what's been happening.
Covid lows
The lows that we had around about the Covid lows all the way down to 4,370 and then we saw this rise to the highs in March last year at 10,845 per tonne. Now this is in the context of what we're doing. I've been illustrating this pattern recently. This is a head and shoulders pattern. The way to spread a head and shoulders pattern is you get the left shoulder, the head which is the high point, in this case it's the right way up, you do get inverted head and shoulders as well.
And then you get this right shoulder here. And when you get a dip down, and this is the candle here which is key, on the 8th of August, a dip down below what is then the neckline because you get the point at which the left and right shoulder hits the head. This is then the neckline and we've been trading below the neckline pretty much all the way since Tuesday the 8th of August.
Price target
Now I highlighted this at the point and I drew the height of the neckline to the top of the head and replicated that dotted line down to here which gave me a price target of not too far away from where we were in the lows back on the 31st of May this year.
Now that is at 8,038. So what I've been saying is my price target is 8,000 here which is a nice round figure. But if you are short on this, if you don't have an open position and you want to continue to do this, today, albeit true, you'd be losing a little bit of money because you've got a little bit of a green candle. This is only what I would perceive to be a little bit of a retracement in what is otherwise a market that's going to continue to go on the way down until we get evidence that either the Chinese authorities are going to step in with some really heavy-hitting support for the markets.
Interest rates
We've seen interest rates down again recently but they're only marginally down by 15 basis points. There's not been any really big money coming in to support the markets. We've seen some evidence today that Chinese authorities want to see funds continue to hold equities across China to give a little bit of support for those that are in the market. But I think broadly speaking we've got this market on the way down. A projection of that head to the neck line gives us this trade down here at 80.38 which was the lowest back on the 31st of May. That would be the area of the price target if you're short on this.
With a stop above yesterday's candle, just above this line which is the neck line up here, see a stop at 80.400, 80.190, price target 8,000. For more videos from us here at IGTV, join us on Twitter at IGcom, Instagram and subscribe to our YouTube channel.
This information has been prepared by IG, a trading name of IG Markets Limited. In addition to the disclaimer below, the material on this page does not contain a record of our trading prices, or an offer of, or solicitation for, a transaction in any financial instrument. IG accepts no responsibility for any use that may be made of these comments and for any consequences that result. No representation or warranty is given as to the accuracy or completeness of this information. Consequently any person acting on it does so entirely at their own risk. Any research provided does not have regard to the specific investment objectives, financial situation and needs of any specific person who may receive it. It has not been prepared in accordance with legal requirements designed to promote the independence of investment research and as such is considered to be a marketing communication. Although we are not specifically constrained from dealing ahead of our recommendations we do not seek to take advantage of them before they are provided to our clients. See full non-independent research disclaimer and quarterly summary.

React to volatility on commodity markets
Trade commodity futures, as well as 27 commodity markets with no fixed expiries.1
- Wide range of popular and niche metals, energies and softs
- Spreads from 0.3 pts on Spot Gold, 2 pts on Spot Silver and 2.8 pts on Oil
- View continuous charting, backdated for up to five years
1In the case of all DFBs, there is a fixed expiry at some point in the future.
See opportunity on a commodity?
Try a risk-free trade in your demo account, and see whether you’re onto something.
- Log in to your demo
- Try a risk-free trade
- See whether your hunch pays off
See opportunity on a commodity?
Don’t miss your chance. Upgrade to a live account to take advantage.
- Analyse and deal seamlessly on fast, intuitive charts
- Get spreads from just 0.3 points on Spot Gold
- See and react to breaking news in-platform
See opportunity on a commodity?
Don’t miss your chance. Log in to take your position.
Live prices on most popular markets
- Equities
- Indices
- Forex
- Commodities
Prices above are subject to our website terms and agreements. Prices are indicative only. All share prices are delayed by at least 15 minutes.
Prices above are subject to our website terms and agreements. Prices are indicative only. All shares prices are delayed by at least 15 mins.