Earnings preview: will AI drive Google numbers?
Alphabet, the Google parent company, is due to report earnings after the Wall Street close this evening. It is forecast to post earnings of $1.34 per share, on revenue of $72.82 billion.

It’s likely to be dominated by AI-related announcements. Investors need to know how the group can drive incremental monetisation through generative AI search. Ad revenue will be key. Google ad revenue is expected to reach $57.45bln, while YouTube ad revenue is seen at $7.41bln by analysts.
(Video Transcript)
Alphabet
One of the big tech companies is reporting after the bell on this Tuesday on Wall Street is Alphabet. The Google parent company is forecast to post earnings of a dollar 34 per share on revenues of 72.82 billion. Now, investors will be attentive to any Al-related announcements. That certainly seems to be what's generating all the interest in these stocks at the moment. They would like to know how the group can drive incremental monetization through generative AI search ad revenue will now be key.
Google & YouTube
Google ad revenue is expected to reach $57.45 billion, while YouTube ad revenue is seen at $7.41 billion by analysts. Cloud growth is another point of interest to watch out for after the bell this evening, when it produces these numbers. In the previous quarter, Google Cloud turned profitable, and for the very first time, revenue in this division was forecast at $7.83 billion.
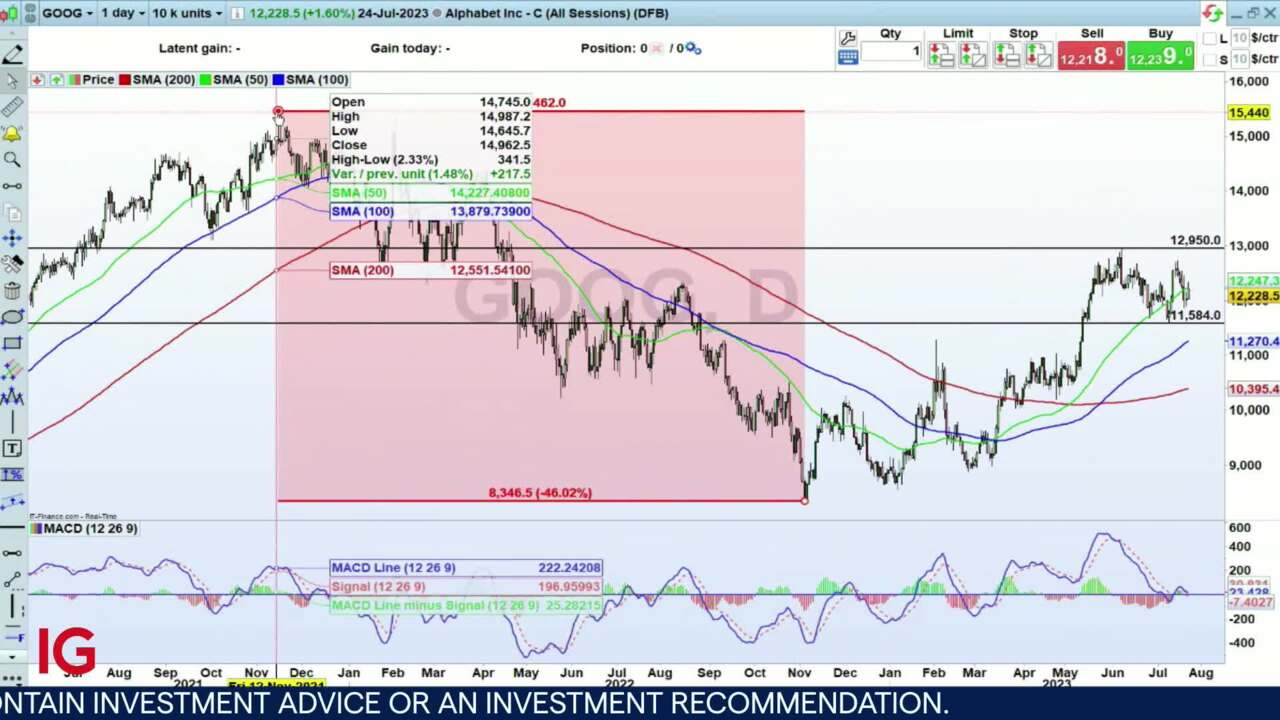
Share price chart
So take a look at the share price chart, which has seen some interesting moves from the highs that we had during the real ramp-up during up through the 12th of November 2021, we were at 154.62. Then came this 46% slump all the way down to the lows seen last November. But since then, there has been a lot of interest in the stock. And now we're trading between this band of support at $115.84. And on the top side here, the resistance hit back on the 8th of June at 129.50 stock.
It's all sessions on the platform, and you can trade this after the bell this evening when it produces its earnings. It'll start today's trade at 122.28. For more videos from a strategy TV, join us on Twitter at IG.com and subscribe to our YouTube channel.
This information has been prepared by IG, a trading name of IG Markets Limited. In addition to the disclaimer below, the material on this page does not contain a record of our trading prices, or an offer of, or solicitation for, a transaction in any financial instrument. IG accepts no responsibility for any use that may be made of these comments and for any consequences that result. No representation or warranty is given as to the accuracy or completeness of this information. Consequently any person acting on it does so entirely at their own risk. Any research provided does not have regard to the specific investment objectives, financial situation and needs of any specific person who may receive it. It has not been prepared in accordance with legal requirements designed to promote the independence of investment research and as such is considered to be a marketing communication. Although we are not specifically constrained from dealing ahead of our recommendations we do not seek to take advantage of them before they are provided to our clients. See full non-independent research disclaimer and quarterly summary.

Seize your opportunity
Deal on the world’s stock indices today.
- Trade on rising or falling markets
- Get one-point spreads on the FTSE 100
- Unrivalled 24-hour pricing
See opportunity on an index?
Try a risk-free trade in your demo account, and see whether you’re on to something.
- Log in to your demo
- Try a risk-free trade
- See whether your hunch pays off
See opportunity on an index?
Don’t miss your chance – upgrade to a live account to take advantage.
- Get spreads from one point on the FTSE 100
- Trade more 24-hour indices than any other provider
- Analyse and deal seamlessly on smart, fast charts
See opportunity on an index?
Don’t miss your chance. Log in to take your position.
Live prices on most popular markets
- Equities
- Indices
- Forex
- Commodities
Prices above are subject to our website terms and agreements. Prices are indicative only. All share prices are delayed by at least 15 minutes.
Prices above are subject to our website terms and agreements. Prices are indicative only. All shares prices are delayed by at least 15 mins.