BP share price and Q1 earnings results preview
Outlook on the BP share price ahead of its upcoming Q1 results.

When are BP ’s results expected?
BP PLC, the British multinational oil and gas company, is set to release its first quarter (Q1) 2023 results on 02 May 2023. The results are for the first quarter ending March 2023.
What is ‘The Street’s’ expectation for the Q1 results?
‘The Street’ expectations for the upcoming results are as follows:
Revenue of $55.042 billion : +7.46% year-on-year (YoY)
Earnings per Share (EPS) : $0.24 : -25% (YoY)
BP shares shrug off oil price fall
For a top-tier energy firm, BP has done remarkably well over the past two years, and has managed to weather the fall in oil prices from their 2022 highs.
2022 saw the firm’s earnings hit their highest level ever, making even bigger gains than those seen in a strong 2021 – underlying profits rose to $27.7 billion, up from $12.8 billion a year earlier.
While the shift to renewables continues, there is still strong demand for oil; the biggest risk to the current outlook would be a recession in 2023 or into 2024, which would likely hit oil demand hard. OPEC’s recent production cut could well help support the market in the near term, but it would be unlikely to be sufficient in stemming any drop in prices should demand slump.
At around 6.6 times earnings, BP shares do not look overly expensive, especially compared to their five-year average of 11.6. Moreover, the 4.1% dividend yield and share buyback programme provides an additional bullish incentive for investors.
How to trade BP into the results
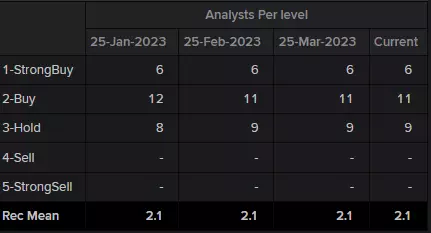
Refinitiv data shows a consensus analyst rating of ‘buy’ for BP – 6 strong buy, 11 buy and 9 hold - with the median of estimates suggesting a long-term price target of 612.50 pence for the share, roughly 14% higher than the current price (as of 25 April 2023).
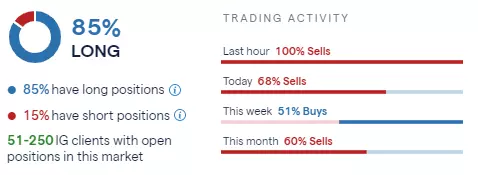
IG sentiment data shows that 85% of clients with open positions on the share (as of 25 April 2023) expect the price to rise over the near term, while 15% of clients expect the price to fall whereas trading activity over this week shows 51% of buys and this month 60% of sells.
BP – technical view
The recovery in the BP share price from its March 467 pence banking crisis low is ongoing despite the recent drop in the oil price dragging the company’s share price lower, to this week’s low at 521.2p.
The remaining price gap with the late March high at 518.2p may still get closed at a later stage but short-term the BP share price will look bullish while Monday’s low at 521.2p underpins with the gap high at 518.2p on a daily chart closing basis.
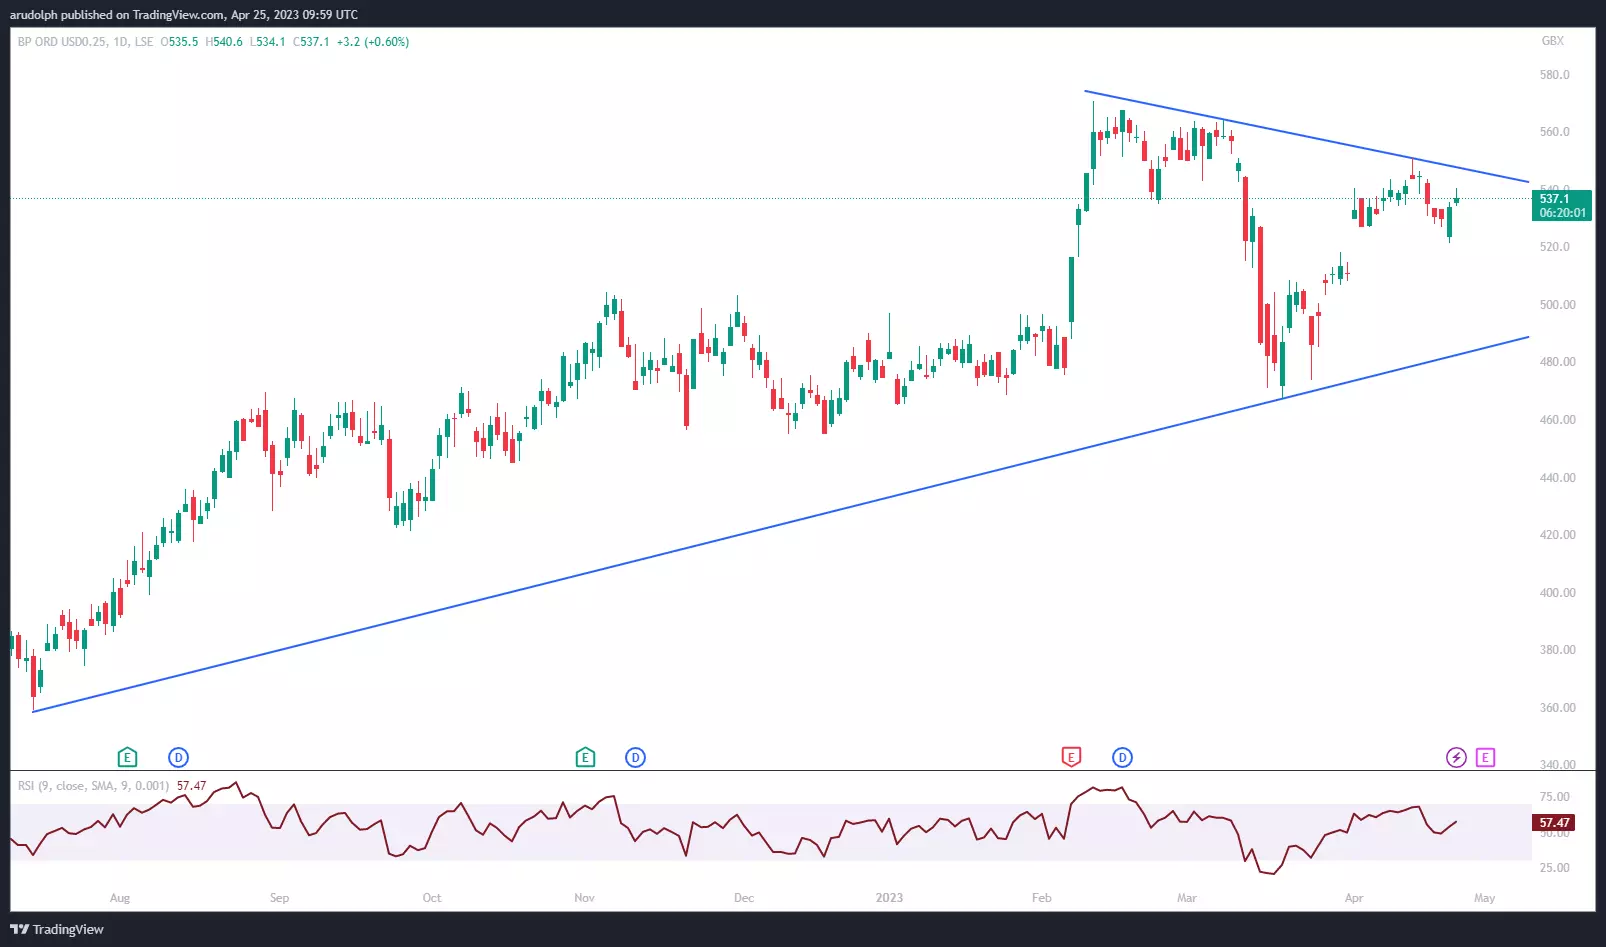
For the bulls to truly be back in control, though, a rise and daily chart close above the current April high at 551p needs to be seen. In this case the February peak at 570.6p would be back in the pipeline, a rise above which would allow for the 2010 peak at 658.2p to be back in play.
The medium-term uptrend, which began in July of last year, remains valid as long as no drop through the March low at 467p unfolds.
Summary
BP is set to release Q1 2023 results on 02 May 2023.
Q1 2023 results are expected to show a 7.46% YoY increase in revenue to $55.042 billion but a 25% YoY fall in EPS to 24 cents per share.
BP remains very profitable and provided the oil price remains high, this shouldn’t change. At around 6.6 times earnings, BP shares do not look overly expensive, especially compared to their five-year average of 11.6. Moreover, the 4.1% dividend yield and share buyback programme provides an additional bullish incentive for investors.
Long-term broker consensus suggests the share to be a ‘buy’, with a median price target of 612.50 pence for the share, roughly 14% higher than the current price.
85% of IG’s clients with open positions are long the share but trading activity over this week shows 51% of buys and this month 60% of sells.
The BP share price remains in a medium-term uptrend, which began in July of last year, as long as no drop through the March low at 467p unfolds. For the bulls to truly be back in control, though, a rise and daily chart close above the current April high at 551p needs to be seen.
This information has been prepared by IG, a trading name of IG Markets Limited. In addition to the disclaimer below, the material on this page does not contain a record of our trading prices, or an offer of, or solicitation for, a transaction in any financial instrument. IG accepts no responsibility for any use that may be made of these comments and for any consequences that result. No representation or warranty is given as to the accuracy or completeness of this information. Consequently any person acting on it does so entirely at their own risk. Any research provided does not have regard to the specific investment objectives, financial situation and needs of any specific person who may receive it. It has not been prepared in accordance with legal requirements designed to promote the independence of investment research and as such is considered to be a marketing communication. Although we are not specifically constrained from dealing ahead of our recommendations we do not seek to take advantage of them before they are provided to our clients. See full non-independent research disclaimer and quarterly summary.

Act on share opportunities today
Go long or short on thousands of international stocks with spread bets and CFDs.
- Get full exposure for a comparatively small deposit
- Trade on spreads from just 0.1%
- Get greater order book visibility with direct market access
See opportunity on a stock?
Try a risk-free trade in your demo account, and see whether you’re on to something.
- Log in to your demo
- Take your position
- See whether your hunch pays off
See opportunity on a stock?
Don’t miss your chance – upgrade to a live account to take advantage.
- Trade a huge range of popular stocks
- Analyse and deal seamlessly on fast, intuitive charts
- See and react to breaking news in-platform
See opportunity on a stock?
Don’t miss your chance. Log in to take advantage while conditions prevail.
Live prices on most popular markets
- Equities
- Indices
- Forex
- Commodities
Prices above are subject to our website terms and agreements. Prices are indicative only. All share prices are delayed by at least 15 minutes.
Prices above are subject to our website terms and agreements. Prices are indicative only. All shares prices are delayed by at least 15 mins.