Asia Day Ahead: AUD/USD higher on Australia’s inflation, while traders digest mixed US big tech results
Further softening in the US 10-year Treasury yields overnight provided room for Wall Street to continue its recovery this week, while focus revolved around the mixed big tech results after-market.


Market Recap
Further softening in the US 10-year Treasury yields overnight provided room for Wall Street to continue its recovery this week (DJIA +0.62%;S&P 500 +0.73%;Nasdaq +0.93%), while the US earnings season thus far has also kept up with its outperformance momentum. Out of the 25% of S&P 500 companies which have released their results, 82% have beaten earnings expectations. This rate of outperformance is above the 5-year average of 77% and 10-year average of 74%.
On the economic calendar, more lukewarm figures from the US flash Purchasing Managers' Index (PMI) data likely add to soft-landing hopes for now, although the data did not drive much sustained market moves. The takeaway is that US economic conditions have stabilised in October after months of decline, as US services PMI turned higher for the first time in five months while the manufacturing sector halted its contractionary trend.
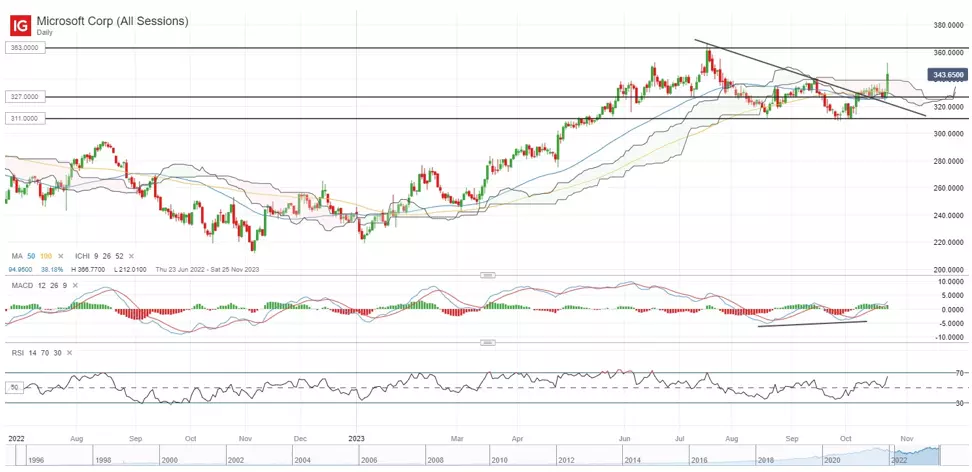
Nevertheless, more focus will revolve around the mixed showing in after-market results from Microsoft's and Alphabet's earnings. For Microsoft, a significant top and bottom-line beat, quicker-than-expected growth in its cloud segment (29% versus 26% consensus) and above-target forecasts supported a 4% gain in share price after-market. On the other hand, Google cloud revenue disappointed with a below-forecast read, with its fourth straight quarter of softening growth failing to convince investors of its competitive edge in its cloud services against other big tech peers. Its share price is down 6% after-market.
If the after-market gain in Microsoft’s share price is sustained tonight, it will mark an upward break of its Ichimoku cloud resistance on the daily chart for the first time since August 2023. Its weekly Relative Strength Index (RSI) has also defended its key 50 level lately, which may support an upward trend in place. Further upside may leave its all-time high at the US$363.00 level on watch for a retest, while crucial support to hold will be at the US$327.00 level.
Asia Open
Asian stocks look set for a mixed open, with Nikkei +1.21%,ASX -0.13% and KOSPI -0.24% at the time of writing. Softening US yields, falling oil prices and a positive handover from Wall Street may be bullish catalysts for the region, but gains seem conflicted as investors continue to digest the mixed US big tech results after-market, along with a strong upmove in the US dollar overnight.
The economic calendar this morning saw higher-than-expected Australia’s inflation numbers across the board, with its 3Q headline inflation rising 5.4% versus the 5.35 forecast. The closely-watched Reserve Bank of Australia (RBA) trimmed mean Consumer Price Index (CPI) also rose 5.2% year-on-year, higher than the 5% forecast, while its monthly CPI indicator rose 5.6% in September, above the expected 5.4%. The more persistent showing in inflation has given rise to some hawkish bets for additional rate hike, especially with earlier guidance from the hawkish RBA minutes in October that “further tightening of policy may be required should inflation prove more persistent than expected.”
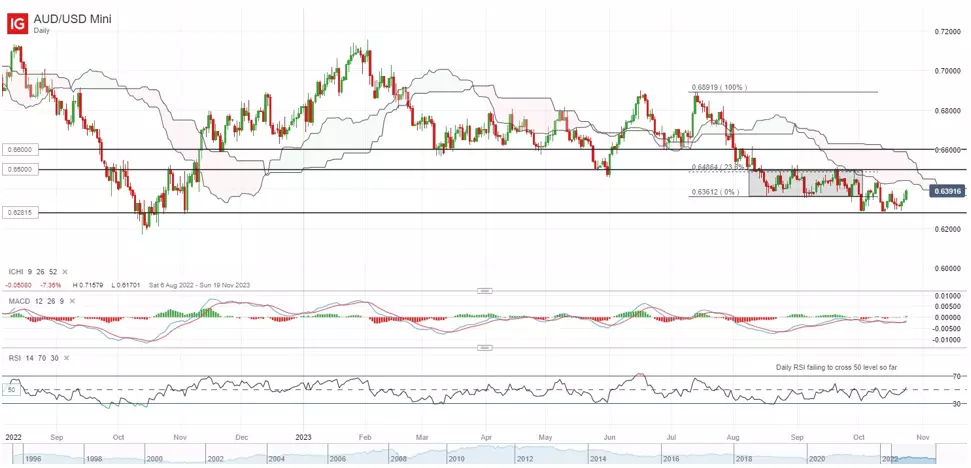
The AUD/USD has found its way higher in today’s session after finding support from its horizontal support at the 0.628 level, while its daily RSI is also attempting for another cross above the 50 level. That said, its looming daily Ichimoku cloud zone on further upside may likely be a strong area of resistance to overcome and conviction for more sustained upmoves may still warrant an upward break of the 0.650 level.
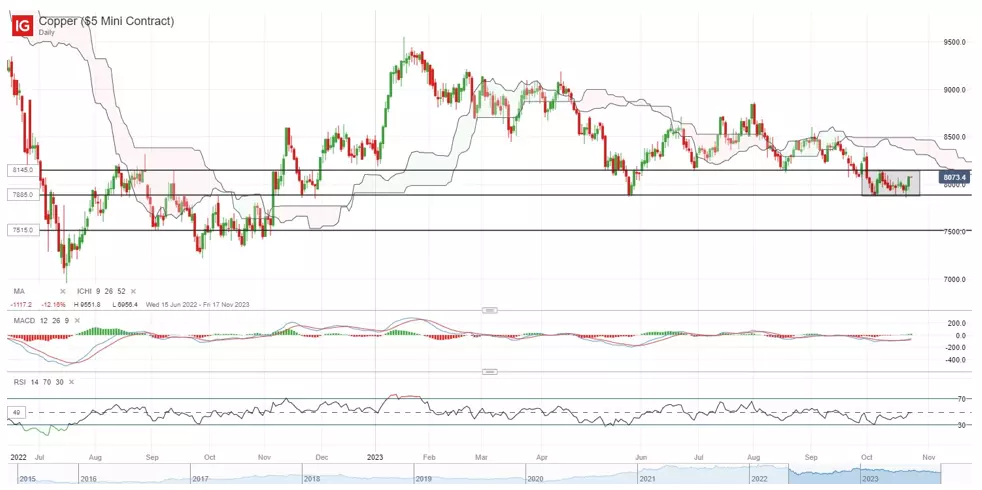
On the watchlist: Copper prices attempting to hold key support
After falling more than 10% since August this year, copper prices have been consolidating above a key horizontal support at the $7,885/tonne level lately as an attempt to stabilise. Near-term conviction for the bulls may come from a move above its October 2022 high at the $8,145/tonne level, along with a reversion in its daily RSI back above the 50 level, which prices have failed to do so over the past month. That may potentially support a move to retest the $8,500/tonne level next, where the daily Ichimoku cloud resistance stands. On the other hand, failure for the $7,885/tonne level to hold may reinforce sellers in control and likely to leave the $7,515/tonne level in sight next.
Tuesday: DJIA +0.62%; S&P 500 +0.73%; Nasdaq +0.93%, DAX +0.54%, FTSE +0.20%
This information has been prepared by IG, a trading name of IG Markets Limited. In addition to the disclaimer below, the material on this page does not contain a record of our trading prices, or an offer of, or solicitation for, a transaction in any financial instrument. IG accepts no responsibility for any use that may be made of these comments and for any consequences that result. No representation or warranty is given as to the accuracy or completeness of this information. Consequently any person acting on it does so entirely at their own risk. Any research provided does not have regard to the specific investment objectives, financial situation and needs of any specific person who may receive it. It has not been prepared in accordance with legal requirements designed to promote the independence of investment research and as such is considered to be a marketing communication. Although we are not specifically constrained from dealing ahead of our recommendations we do not seek to take advantage of them before they are provided to our clients. See full non-independent research disclaimer and quarterly summary.

Act on share opportunities today
Go long or short on thousands of international stocks with spread bets and CFDs.
- Get full exposure for a comparatively small deposit
- Trade on spreads from just 0.1%
- Get greater order book visibility with direct market access
See opportunity on a stock?
Try a risk-free trade in your demo account, and see whether you’re on to something.
- Log in to your demo
- Take your position
- See whether your hunch pays off
See opportunity on a stock?
Don’t miss your chance – upgrade to a live account to take advantage.
- Trade a huge range of popular stocks
- Analyse and deal seamlessly on fast, intuitive charts
- See and react to breaking news in-platform
See opportunity on a stock?
Don’t miss your chance. Log in to take advantage while conditions prevail.
Live prices on most popular markets
- Equities
- Indices
- Forex
- Commodities
Prices above are subject to our website terms and agreements. Prices are indicative only. All share prices are delayed by at least 15 minutes.
Prices above are subject to our website terms and agreements. Prices are indicative only. All shares prices are delayed by at least 15 mins.