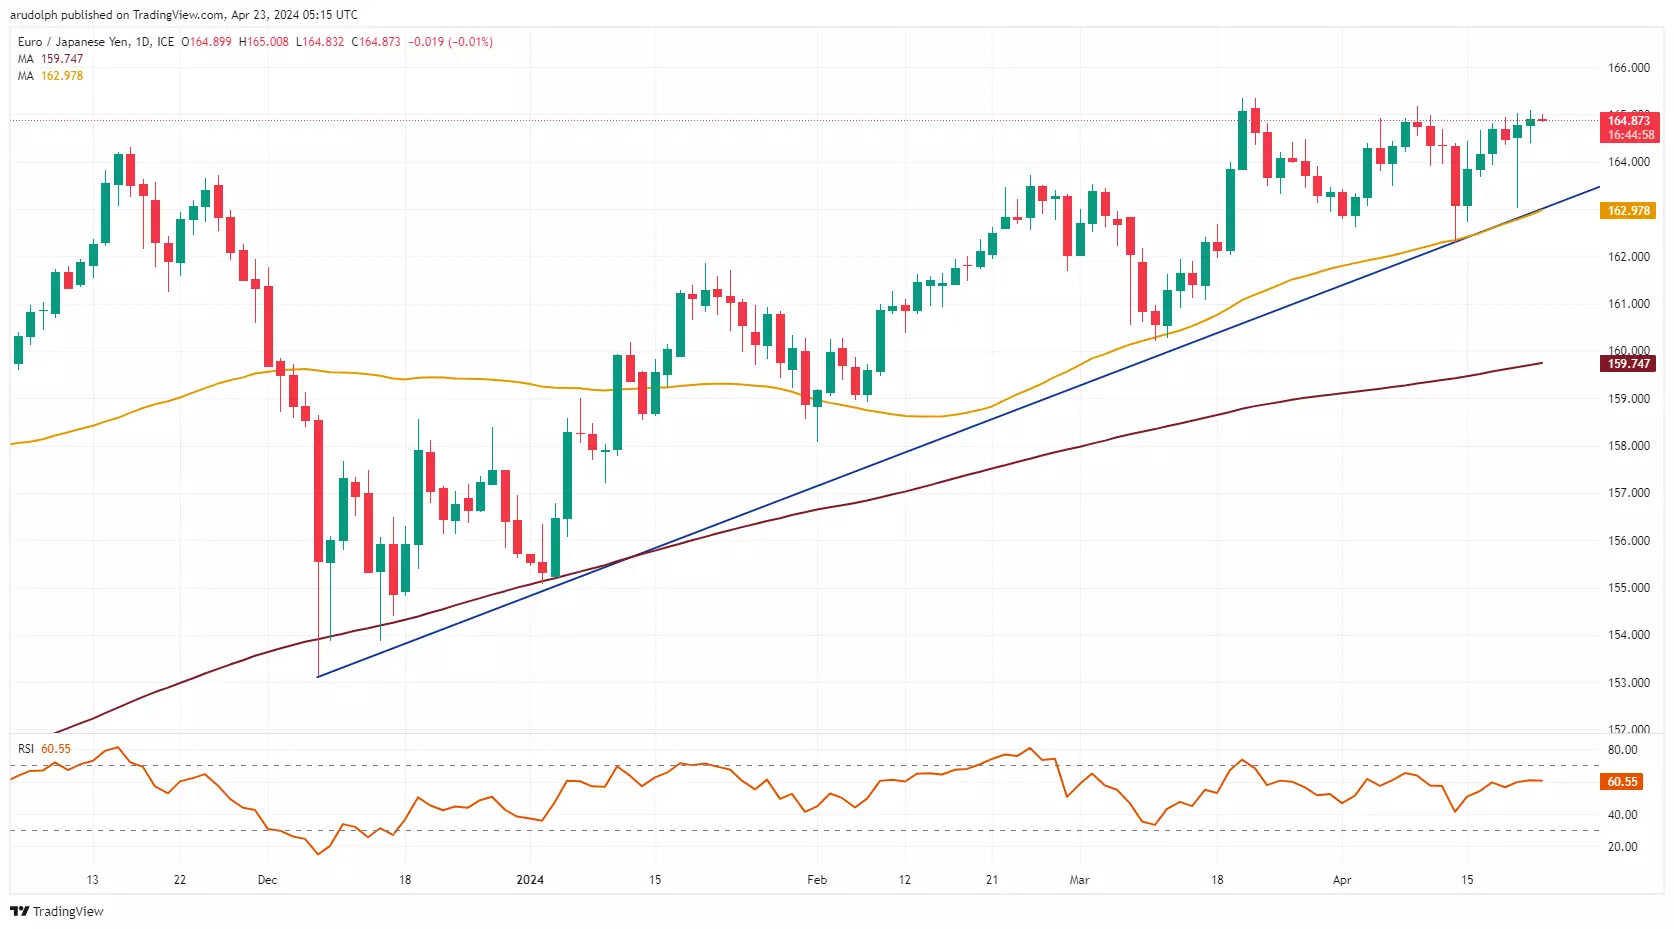
USD/JPY trades in 34-year highs while EUR/JPY rises and AUD/USD stabilizes
Yen continues to depreciate despite Japan manufacturing PMI hitting an 11-month peak.


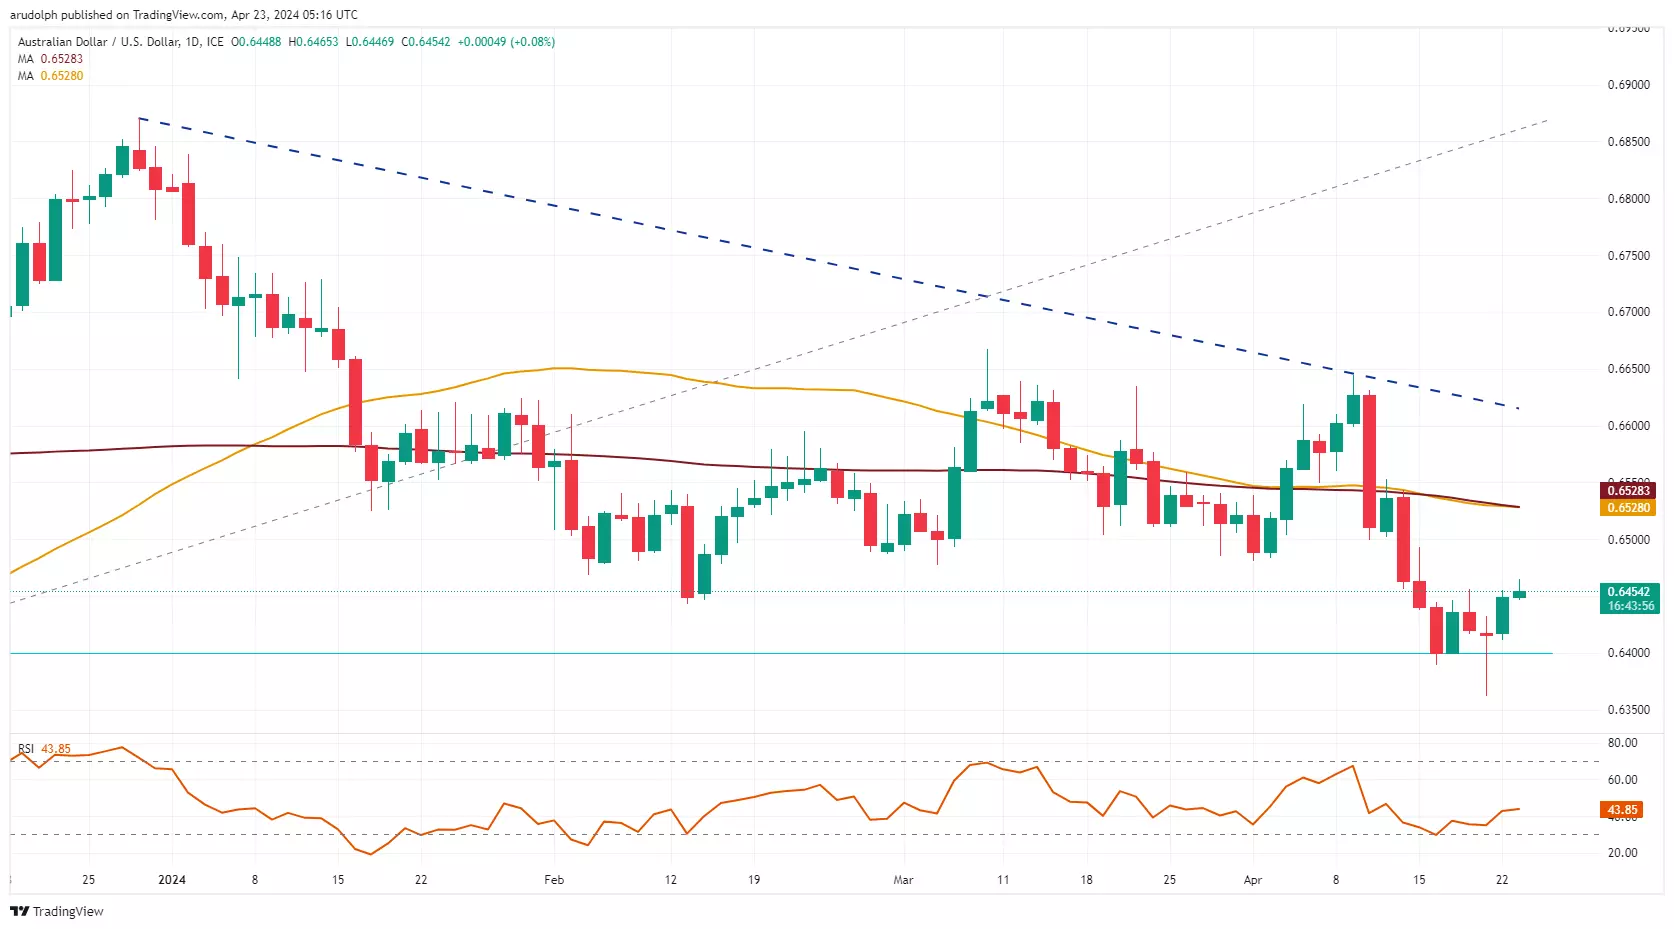
AUD/USD bounces off 5-month low
AUD/USD bounces off Friday's $0.6363 low but so far has only briefly risen above Thursday's $0.6456 high, above which sits the $0.6493-99 minor resistance area.
Support below Monday's intraday low at $0.6412 comes in around the 78.6% Fibonacci retracement of the October-to-December advance and Tuesday's low at $0.64 to $0.639. Further down sits Friday's low at $0.6363.
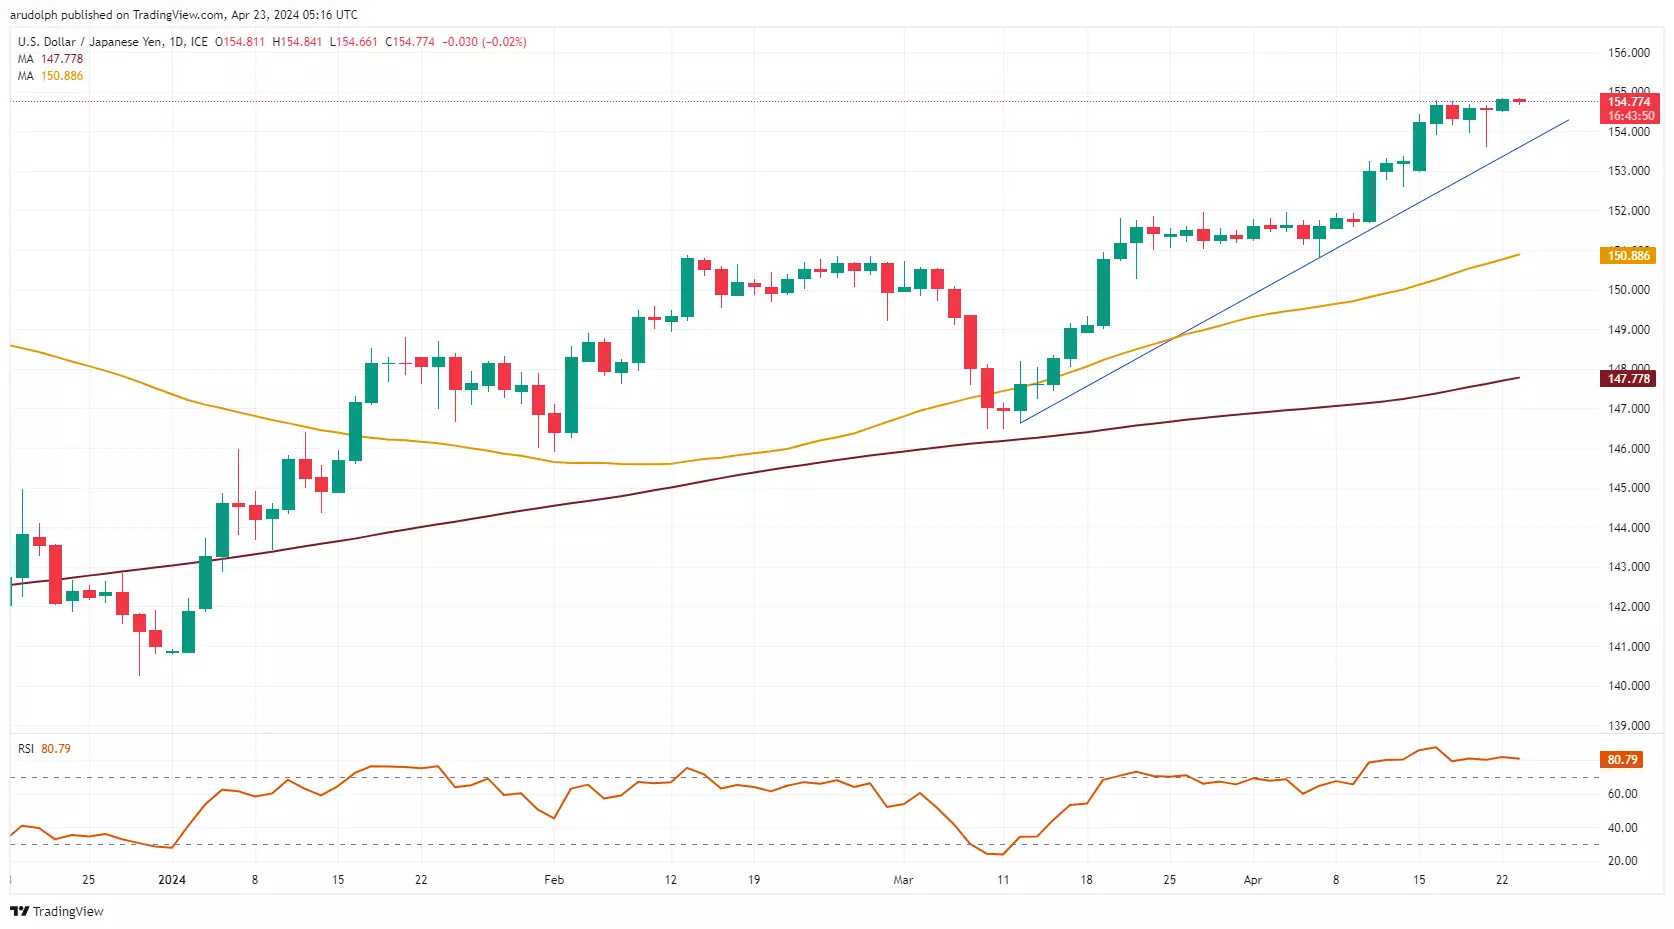
USD/JPY hits January 1990 levels
USD/JPY has so far risen to ¥154.85, a level last traded in January 1990, and close to the ¥155.00 mark around which the Bank of Japan (BoJ) may intervene.
Upside pressure will remain in play while Friday's low at ¥153.60 underpins. Were this level to give way, though, the 12 April low at ¥152.60 and the ¥151.97-91 area might be back in play.
This information has been prepared by IG, a trading name of IG Markets Limited. In addition to the disclaimer below, the material on this page does not contain a record of our trading prices, or an offer of, or solicitation for, a transaction in any financial instrument. IG accepts no responsibility for any use that may be made of these comments and for any consequences that result. No representation or warranty is given as to the accuracy or completeness of this information. Consequently any person acting on it does so entirely at their own risk. Any research provided does not have regard to the specific investment objectives, financial situation and needs of any specific person who may receive it. It has not been prepared in accordance with legal requirements designed to promote the independence of investment research and as such is considered to be a marketing communication. Although we are not specifically constrained from dealing ahead of our recommendations we do not seek to take advantage of them before they are provided to our clients. See full non-independent research disclaimer and quarterly summary.

Start trading forex today
Find opportunity on the world’s most-traded – and most-volatile – financial market.
- Trade spreads from just 0.6 points on EUR/USD
- Analyse with clear, fast charts
- Speculate wherever you are with our intuitive mobile apps
See an FX opportunity?
Try a risk-free trade in your demo account, and see whether you’re onto something.
- Log in to your demo
- Take your position
- See whether your hunch pays off
See an FX opportunity?
Don’t miss your chance – upgrade to a live account to take advantage.
- Get spreads from just 0.6 points on popular pairs
- Analyse and deal seamlessly on fast, intuitive charts
- See and react to breaking news in-platform
See an FX opportunity?
Don’t miss your chance. Log in to take your position.
Live prices on most popular markets
- Equities
- Indices
- Forex
- Commodities
Prices above are subject to our website terms and agreements. Prices are indicative only. All share prices are delayed by at least 15 minutes.
Prices above are subject to our website terms and agreements. Prices are indicative only. All shares prices are delayed by at least 15 mins.