EUR/USD, GBP/USD slip while USD/JPY regains lost ground post Israel attack on Iran
EUR/USD, GBP/USD slip while USD/JPY regains lost ground as safe haven flows lead to further US dollar strength


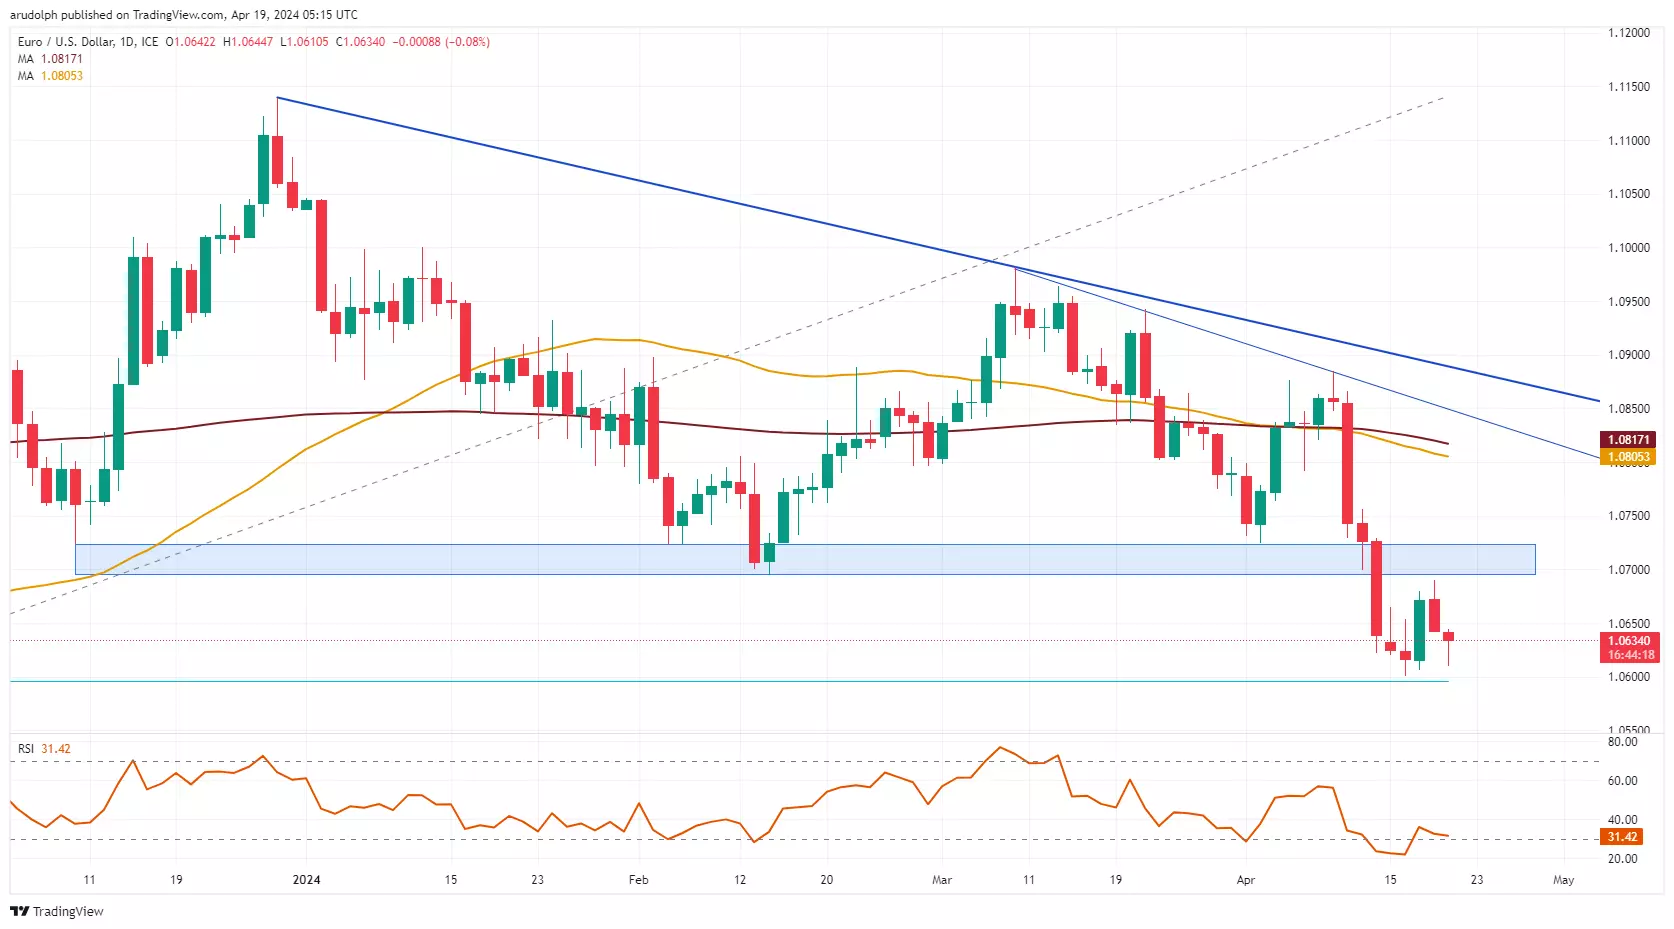
EUR/USD slips again
Following its past couple of days' bounce, EUR/USD is heading back down again amid escalation in the Middle East. The cross eyes Tuesday's low at $1.0601 and the 78.6% Fibonacci retracement of the October-to-December advance at $1.0596. Below this level the late-October lows at $1.0522 to $1.0517 as well as the $1.0449 October low remain in sight.
Resistance sits at Thursday's $1.069 high, made slightly below the key $1.0695 to $1.0725 resistance zone.
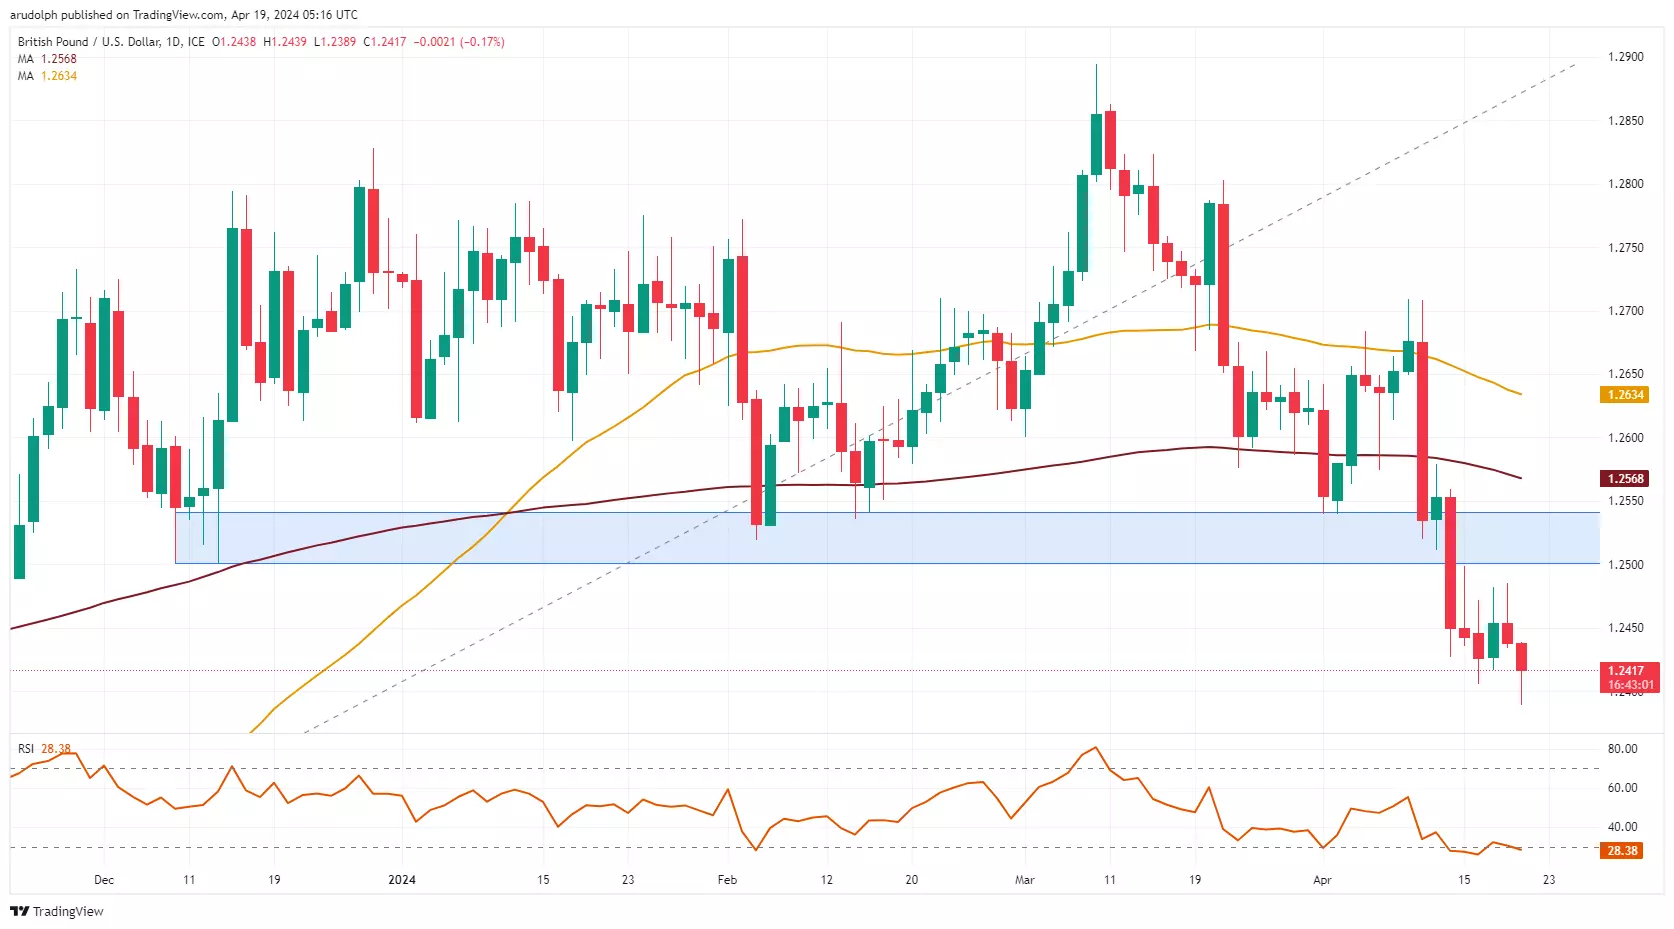
GBP/USD drops further
GBP/USD's bounce towards the $1.25 mid-December low was short-lived with the cross falling to new five-months lows as Israel fires missiles at Iran and the US dollar gains on flight to safety flows.
Support sits at the $1.2374 mid-November low ahead of the 61.8% Fibonacci retracement of the October-to-March rise at $1.2365.
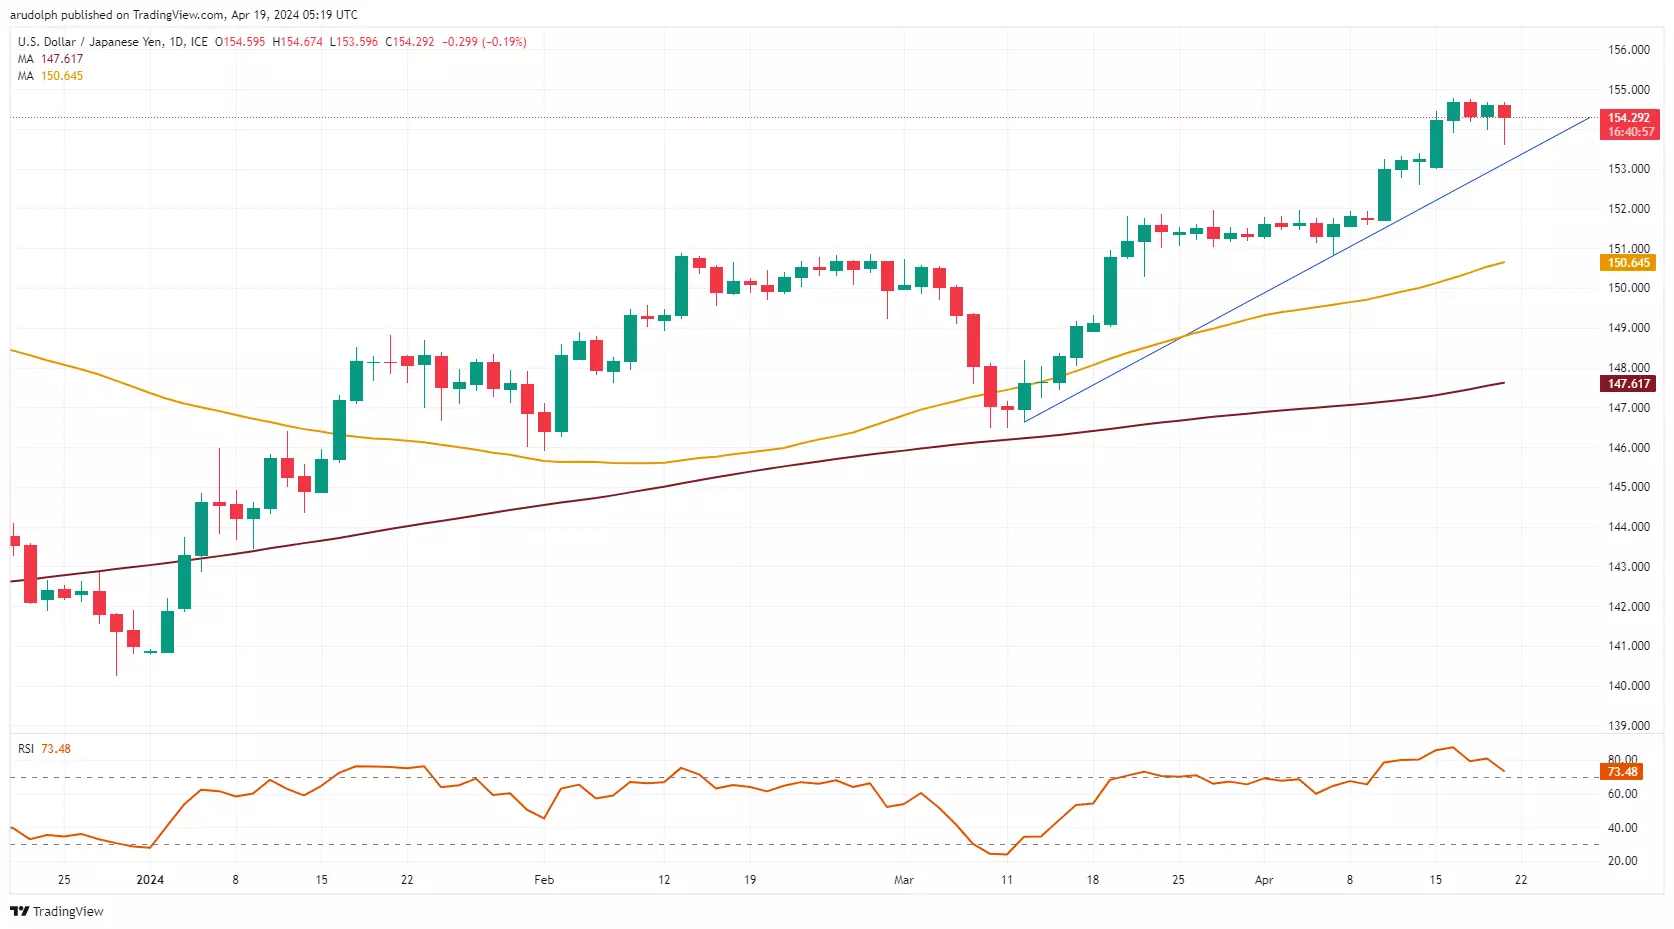
USD/JPY falls but then recovers
USD/JPY short-term slid to ¥153.60 before resuming its ascent towards the ¥155.00 mark around which the Bank of Japan (BoJ) may intervene.
Upside pressure will remain in play while last Friday's low at ¥152.60 holds. Were this level to give way, though, the the ¥151.97-91 area might be back in play.
This information has been prepared by IG, a trading name of IG Markets Limited. In addition to the disclaimer below, the material on this page does not contain a record of our trading prices, or an offer of, or solicitation for, a transaction in any financial instrument. IG accepts no responsibility for any use that may be made of these comments and for any consequences that result. No representation or warranty is given as to the accuracy or completeness of this information. Consequently any person acting on it does so entirely at their own risk. Any research provided does not have regard to the specific investment objectives, financial situation and needs of any specific person who may receive it. It has not been prepared in accordance with legal requirements designed to promote the independence of investment research and as such is considered to be a marketing communication. Although we are not specifically constrained from dealing ahead of our recommendations we do not seek to take advantage of them before they are provided to our clients. See full non-independent research disclaimer and quarterly summary.

Start trading forex today
Find opportunity on the world’s most-traded – and most-volatile – financial market.
- Trade spreads from just 0.6 points on EUR/USD
- Analyse with clear, fast charts
- Speculate wherever you are with our intuitive mobile apps
See an FX opportunity?
Try a risk-free trade in your demo account, and see whether you’re onto something.
- Log in to your demo
- Take your position
- See whether your hunch pays off
See an FX opportunity?
Don’t miss your chance – upgrade to a live account to take advantage.
- Get spreads from just 0.6 points on popular pairs
- Analyse and deal seamlessly on fast, intuitive charts
- See and react to breaking news in-platform
See an FX opportunity?
Don’t miss your chance. Log in to take your position.
Live prices on most popular markets
- Equities
- Indices
- Forex
- Commodities
Prices above are subject to our website terms and agreements. Prices are indicative only. All share prices are delayed by at least 15 minutes.
Prices above are subject to our website terms and agreements. Prices are indicative only. All shares prices are delayed by at least 15 mins.