EUR/GBP slides while GBP/USD and USD/CNH gradually advance
Outlook on EUR/GBP, GBP/USD and USD/CNH as US is shut for Martin Luther King Jr. holiday.


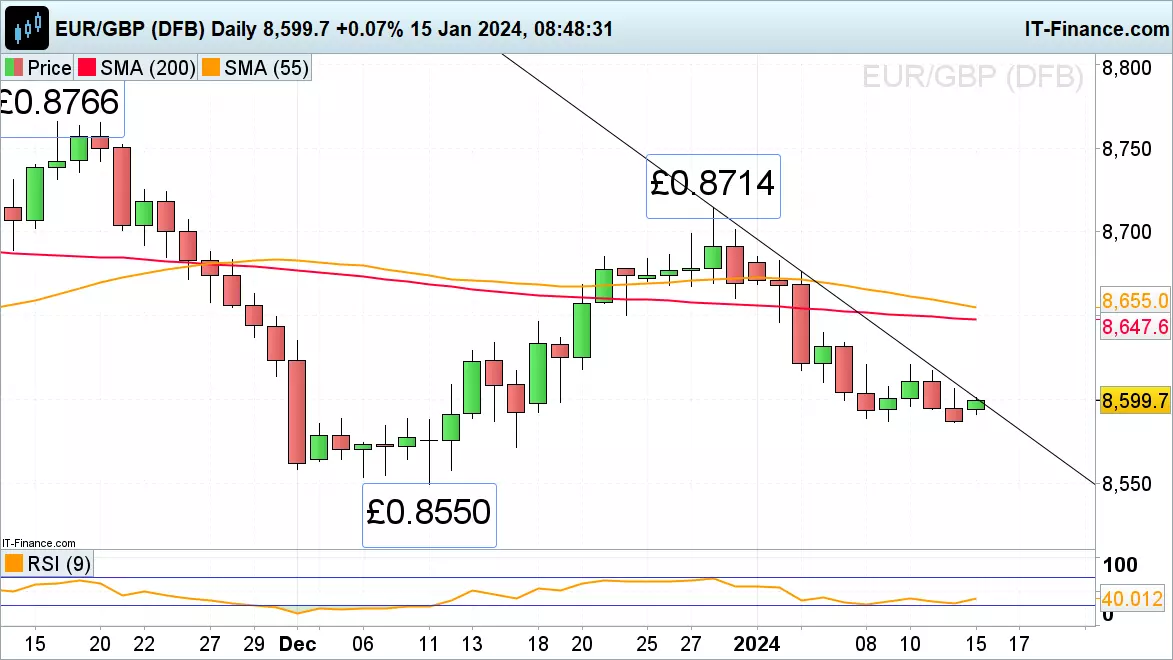
EUR/GBP weighs on the £0.86 region
EUR/GBP's drop from its £0.8714 December high has taken it to last week’s £0.8587 low which remains in sight after President Lagarde reassured markets on Friday that interest rates will fall once inflation is under control.
A drop through last week’s £0.8587 low would eye the 15 December low at £0.8572 and perhaps also the December low at £0.855.
Minor resistance remains to be seen at last week’s £0.8621 high and the previous Friday’s £0.8634 high.
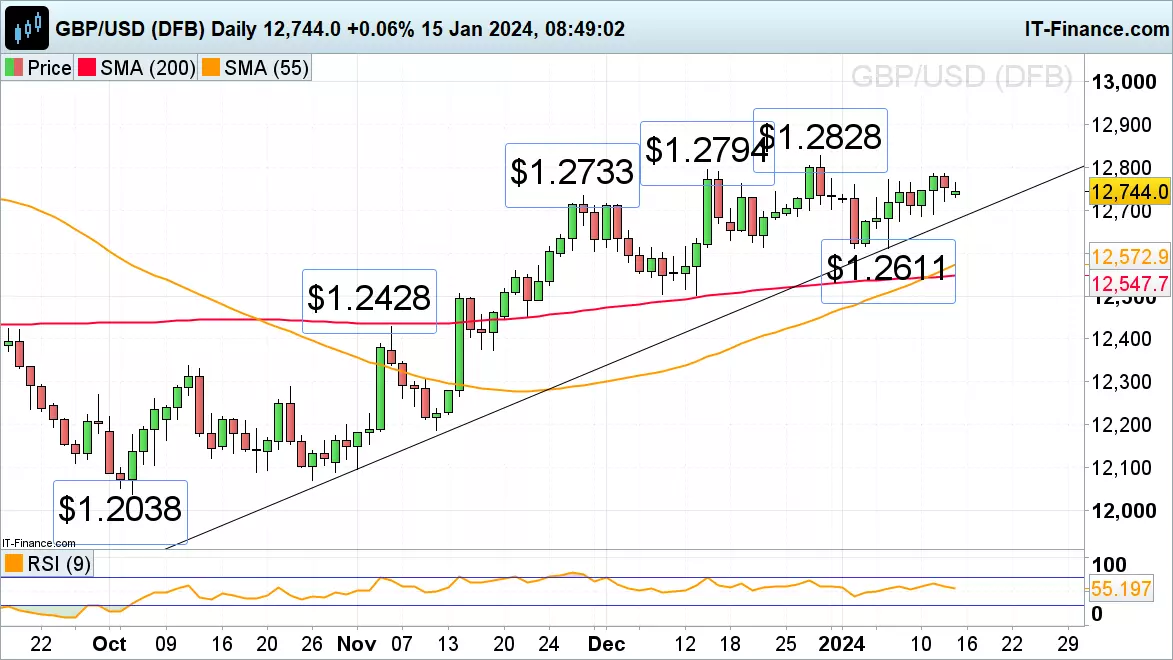
GBP/USD nears mid-December peak
GBP/USD's advance from its early January low at $1.2611 still has the mid-December high at $1.2794 and the December five-month peak at $1.2828 in its sights.
Upside pressure should play a dominant role while Wednesday’s low at $1.2687 holds.
Minor support at Wednesday’s $1.2745 high is currently being tested. Below it lies good support along the November-to-January uptrend line, 21 December and current January lows at $1.2679 to $1.2611.
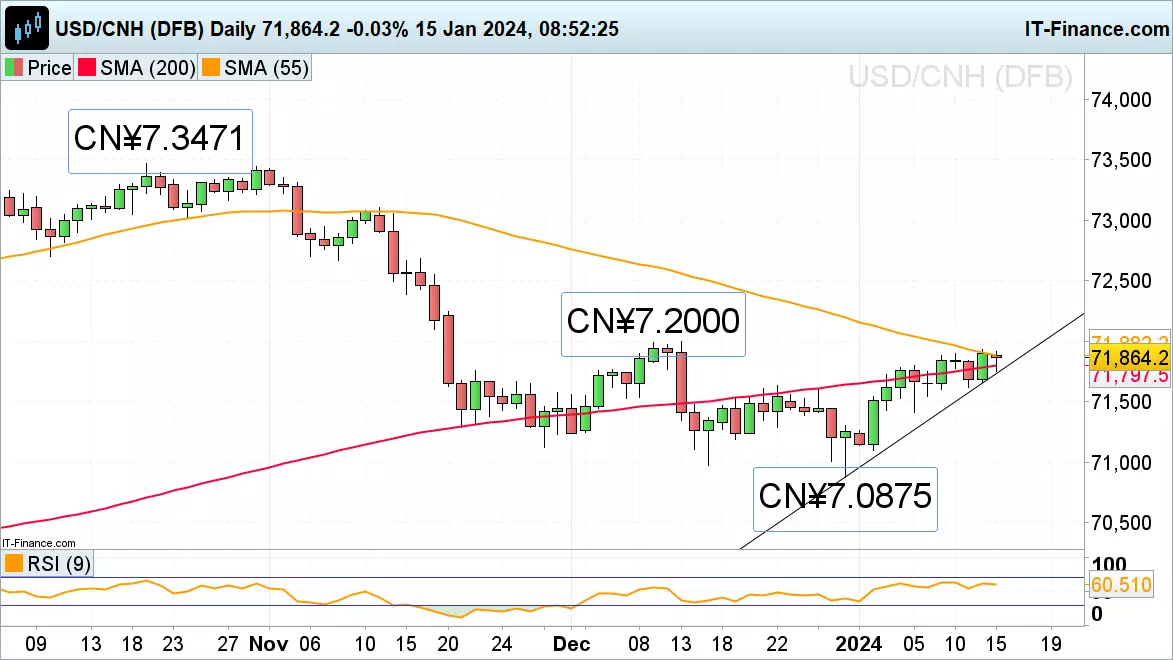
USD/CNH continues to gradually advance
USD/CNH's gradual advance from its eight-month low at CN¥7.0875 along the 200-day simple moving average (SMA) at CN¥7.1797 has so far taken it to the 55-day SMA at CN¥7.1883 and Friday’s high at CN¥7.193. This despite the Chinese central bank sticking to its medium-lending rate amid rate cut expectations.
Support below the 200-day SMA at CN¥7.1797 and the January tentative uptrend line at CN¥7.1735 is seen at Thursday’s CN¥7.1617 low.
A rise above Friday’s CN¥7.193 high could lead to the December peak at CN¥7.2 being back in focus.
This information has been prepared by IG, a trading name of IG Markets Limited. In addition to the disclaimer below, the material on this page does not contain a record of our trading prices, or an offer of, or solicitation for, a transaction in any financial instrument. IG accepts no responsibility for any use that may be made of these comments and for any consequences that result. No representation or warranty is given as to the accuracy or completeness of this information. Consequently any person acting on it does so entirely at their own risk. Any research provided does not have regard to the specific investment objectives, financial situation and needs of any specific person who may receive it. It has not been prepared in accordance with legal requirements designed to promote the independence of investment research and as such is considered to be a marketing communication. Although we are not specifically constrained from dealing ahead of our recommendations we do not seek to take advantage of them before they are provided to our clients. See full non-independent research disclaimer and quarterly summary.

Start trading forex today
Find opportunity on the world’s most-traded – and most-volatile – financial market.
- Trade spreads from just 0.6 points on EUR/USD
- Analyse with clear, fast charts
- Speculate wherever you are with our intuitive mobile apps
See an FX opportunity?
Try a risk-free trade in your demo account, and see whether you’re onto something.
- Log in to your demo
- Take your position
- See whether your hunch pays off
See an FX opportunity?
Don’t miss your chance – upgrade to a live account to take advantage.
- Get spreads from just 0.6 points on popular pairs
- Analyse and deal seamlessly on fast, intuitive charts
- See and react to breaking news in-platform
See an FX opportunity?
Don’t miss your chance. Log in to take your position.
Live prices on most popular markets
- Equities
- Indices
- Forex
- Commodities
Prices above are subject to our website terms and agreements. Prices are indicative only. All share prices are delayed by at least 15 minutes.
Prices above are subject to our website terms and agreements. Prices are indicative only. All shares prices are delayed by at least 15 mins.