FTSE 100 remains strong, DAX and Dow subdued
While the FTSE 100 remains strong, the DAX and Dow look subdued above last week’s lows.
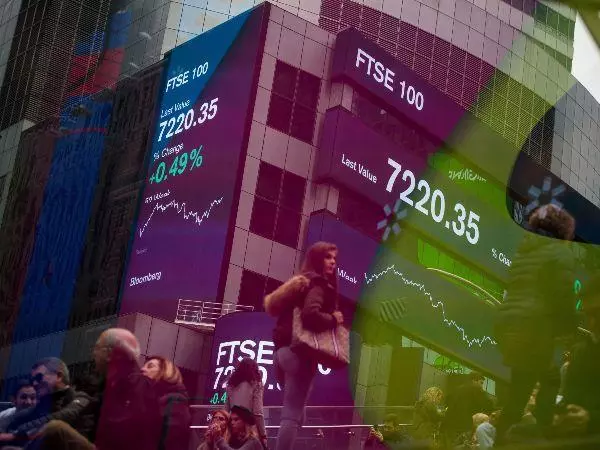
FTSE 100 trades at near two-year highs
The FTSE 100 continues to trade at levels last seen in February 2020 whilst staying above that month’s high at 7549. The July 2019 high at 7622 and the pre-pandemic December 2019 and January 2020 highs at 7680 to 7690 continue to be targeted.
Immediate upside pressure should be maintained while the index stays above the 7530 to 7507 support area which consists of the early January high and the 14 January low.

Further sideways trading on the cards for DAX ahead of ZEW Economic Sentiment
The DAX index continues to oscillate around the 16000 mark, having last week been capped by minor resistance made up of the early November high and 19 November low at 16089 to 16091 whilst holding above the 14 January 15833 low and awaiting Tuesday’s German ZEW Economic sentiment data.
Only a rise above last week’s high at 16090 would push the November and early January highs at 16288 to 16299 to the fore, whereas a slip through 15833 would likely engage the 55-day simple moving average (SMA) and current January low at 15771 to 15725.

Dow remains fragile whilst hovering above recent lows
The Dow is expected to oscillate further around the 55-day SMA at 35783 today and may revisit the two-month uptrend line at 35690. Below it sits key support at this year’s lows to date at 35643 to 35639. Failure there would lead to the 29 November high at 35306 being next in line with the 200-day SMA at 35162 representing another potential downside target.
Only a rise above last week’s high at 36512 would negate the current short-term bearish bias and engage the 36569 November peak. Above it the December high can be spotted at 36685 and also the current January peak at 36955.


Seize your opportunity
Deal on the world’s stock indices today.
- Trade on rising or falling markets
- Get one-point spreads on the FTSE 100
- Unrivalled 24-hour pricing
See opportunity on an index?
Try a risk-free trade in your demo account, and see whether you’re on to something.
- Log in to your demo
- Try a risk-free trade
- See whether your hunch pays off
See opportunity on an index?
Don’t miss your chance – upgrade to a live account to take advantage.
- Get spreads from one point on the FTSE 100
- Trade more 24-hour indices than any other provider
- Analyse and deal seamlessly on smart, fast charts
See opportunity on an index?
Don’t miss your chance. Log in to take your position.
Related articles
Live prices on most popular markets
- Equities
- Indices
- Forex
- Commodities
Prices above are subject to our website terms and agreements. Prices are indicative only. All share prices are delayed by at least 15 minutes.
Prices above are subject to our website terms and agreements. Prices are indicative only. All shares prices are delayed by at least 15 mins.