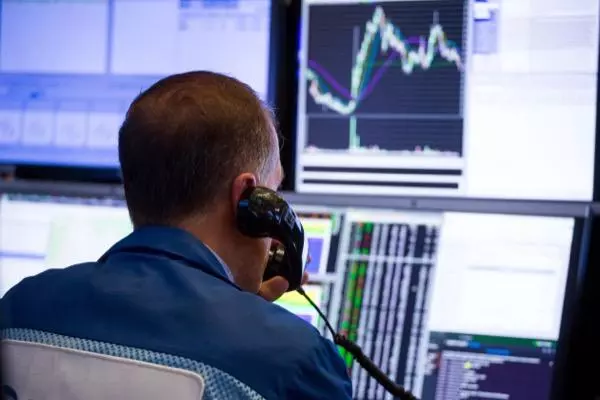
Can the S&P 500 keep going?
Now that the benchmark US index is back at a record high, will it be able to keep going?

If you had told someone back in mid-March that the S&P 500 would hit a new record before the summer was finished, they would probably have thought you to be misguided at best, and mad at worst.
But this week, that is exactly what happened. It has taken 126 days for the S&P 500, the most important stock market in the world, to reach a new peak. There has indeed been a V-shaped recovery, but not in the economy.
The question investors must ask themselves is ‘what comes next?’ Having surpassed the previous peak, it is fairly certain that we can no longer call this a ‘bear market rally’. But can it keep going? That is impossible to know, but we can at least look back at previous performance to get a sense of what comes next.
On average, the stock market goes up, most of the time. Indeed, Goldman Sachs once calculated that the probability of the market going up on any given day was around 66%, that is to say the market goes up on two out of every three days. The chart below shows what we expect for market performance for an ‘average’ day:

The longer a position is held, the bigger the return, and the greater the probability of a positive performance. For the performance after a record high, the chart looks like this:

The performance is broadly similar, and if anything is better on the six- and twelve-month timeframes. All-time highs are not bearish, a fact many people find hard to grasp. They show that momentum is still strong, and in the stock market momentum begets momentum.
‘Ah but the market was at a record high in February and then crashed’, people will say. This is true, but it crashed because of a global pandemic that no one saw coming. Even if cases keep rising from here, the market has adjusted to a world with Covid-19 in it. It may lose ground, but a repeat of February and March is very unlikely.
‘Oh well it’s only going up because of the FANG stocks’ – this is the next argument that gets deployed. Usually people then bring up a chart of the ‘S&P 495’, i.e. the index without the biggest winners. This shows it is still well below previous highs, as if somehow taking out the bits you don’t like is a way of validating a bearish view. But you can’t trade this magical index, it is only an exercise in data mining. A stock market index is an average – the clue is right there. Some stocks do well, others badly. Some do really well, and some do really badly. Perhaps we could create an index where we strip out all the underperformers. That would do really well!
In truth, the S&P 500 is the world’s greatest momentum fund. The losers drop out as the index is rebalanced, and new stocks are added that meet the criteria. Meanwhile, the winners keep on winning, getting bigger and bigger. This is how indices work. The S&P 500 has done well because it has lots of tech stocks, with strong performers like healthcare in there too. The Nasdaq has done even better, because it has these stocks in it, but also fewer poor performers like energy and airlines. European markets do not have these big-name tech stocks either, and this is part of the reason why they have underperformed so much relative to the US since 2009.
There may well be a reason to drive the S&P 500 down later this year, but chances are whatever that reason is, it will not be something we can predict now. And another huge market fall will likely be accompanied by economic disruption, which raises the prospect of central bank and government stimulus, another key driver of the rebound in risk assets.
Betting on further sustained falls seems unlikely to be a successful approach for the time being. The market has been able to weather bad news on the corporate and economic fronts, and with bond yields so low equities continue to be an attractive asset class for income investors. While the US presidential election could provide a bump in the road, the outlook for the final months of the year is usually quite strong for equities, particularly from mid-October onwards. This record high looks set to be breached in due course, as the stock market continues to climb.

Seize your opportunity
Deal on the world’s stock indices today.
- Trade on rising or falling markets
- Get one-point spreads on the FTSE 100
- Unrivalled 24-hour pricing
See opportunity on an index?
Try a risk-free trade in your demo account, and see whether you’re on to something.
- Log in to your demo
- Try a risk-free trade
- See whether your hunch pays off
See opportunity on an index?
Don’t miss your chance – upgrade to a live account to take advantage.
- Get spreads from one point on the FTSE 100
- Trade more 24-hour indices than any other provider
- Analyse and deal seamlessly on smart, fast charts
See opportunity on an index?
Don’t miss your chance. Log in to take your position.
Related articles
Live prices on most popular markets
- Equities
- Indices
- Forex
- Commodities
Prices above are subject to our website terms and agreements. Prices are indicative only. All share prices are delayed by at least 15 minutes.
Prices above are subject to our website terms and agreements. Prices are indicative only. All shares prices are delayed by at least 15 mins.