Skip to content

Spread bets and CFDs are complex instruments and come with a high risk of losing money rapidly due to leverage. 71% of retail investor accounts lose money when trading spread bets and CFDs with this provider. You should consider whether you understand how spread bets and CFDs work, and whether you can afford to take the high risk of losing your money.

​​​WTI stalls on demand concerns while gold and silver fall as greenback hits 6-month highs

​​Outlook on WTI, gold and silver amid appreciating US dollar and slowing growth in China​.

Source: Bloomberg

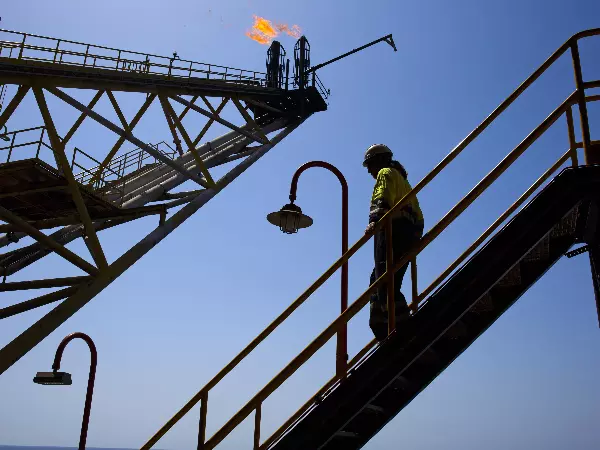
​​​WTI stalls at ten-month high ​ ​

WTI’s over 10% rally on tighter supply and increased optimism surrounding China’s stimuli is stalling on fears that future energy demand could weaken amid China’s slowing economic growth. The country’s trade surplus narrowed in August as exports declined on softer external demand, while imports also fell amid weak domestic consumption.

​Further consolidation below this week’s high at $87.61 is thus at hand. Were this high to be exceeded, however, the 11 November 2022 high at $89.39 would be targeted ahead of the psychological $90 region. ​Minor support sits at the 1 September high at $85.70 and more important support at the $84.39 August peak.

Source: ProRealTime

​Gold price drops on three consecutive days on rising US dollar ​

Gold’s advance from its $1,885 per troy ounce August low has taken it to last week’s $1,953 high as the US dollar’s appreciation gave way to a corrective move lower. Now that the greenback resumed its ascendency and trades in six-month highs, the precious metal price is seen slipping again. ​

Currently the 200-day simple moving average (SMA) at $1,919 is being revisited with the 25 August low at $1,904 representing a possible additional downside target. ​Resistance comes in along the 55-day simple moving average (SMA) at $1,931 and also around the late July low at $1,943.

Source: ProRealTime

​Silver on track for seventh consecutive day of decline

​Silver’s bearish reversal off its $25.01 August peak has swiftly taken it back down towards the mid-August high at $23.01. If fallen through, the late May low at $22.68 would be next in focus, followed by the key $22.23 to $22.12 support zone. It consists of the June and August lows. ​Resistance can now be found between the 200- and 55-day simple moving averages (SMAs) at $23.47 to $23.64.

Source: ProRealTime

Related articles

Live prices on most popular markets

  • Equities
  • Indices
  • Forex
  • Commodities
website terms and agreements. Prices are indicative only. All share prices are delayed by at least 15 minutes.

" >


Prices above are subject to our website terms and agreements. Prices are indicative only. All share prices are delayed by at least 15 minutes.

Prices above are subject to our website terms and agreements. Prices are indicative only. All shares prices are delayed by at least 15 mins.

Plan your trading week

Get the week’s market-moving news sent directly to your inbox every Monday. The Week Ahead gives you a full calendar of upcoming economic events, as well as commentary from our expert analysts on the key markets to watch.


You might be interested in…

Find out what charges your trades could incur with our transparent fee structure.

Discover why so many clients choose us, and what makes us a world-leading provider of spread betting and CFDs.

Stay on top of upcoming market-moving events with our customisable economic calendar.


This information has been prepared by IG, a trading name of IG Markets Limited. In addition to the disclaimer below, the material on this page does not contain a record of our trading prices, or an offer of, or solicitation for, a transaction in any financial instrument. IG accepts no responsibility for any use that may be made of these comments and for any consequences that result. No representation or warranty is given as to the accuracy or completeness of this information. Consequently any person acting on it does so entirely at their own risk. Any research provided does not have regard to the specific investment objectives, financial situation and needs of any specific person who may receive it. It has not been prepared in accordance with legal requirements designed to promote the independence of investment research and as such is considered to be a marketing communication. Although we are not specifically constrained from dealing ahead of our recommendations we do not seek to take advantage of them before they are provided to our clients. See full non-independent research disclaimer and quarterly summary.