Skip to content

Spread bets and CFDs are complex instruments and come with a high risk of losing money rapidly due to leverage. 71% of retail investor accounts lose money when trading spread bets and CFDs with this provider. You should consider whether you understand how spread bets and CFDs work, and whether you can afford to take the high risk of losing your money.

​FTSE 100, DAX 40 and S&P 500 rally on US debt ceiling optimism

​​Outlook on FTSE 100, DAX 40 and S&P 500 amid a more positive outlook US debt ceiling negotiations.

Source: Bloomberg

​​​FTSE 100 continues to range trade

​The FTSE 100 tries to rise back to this week’s high at 7,806 amid ongoing optimism regarding negotiations over the US debt ceiling. ​For the bulls to be fully back in control, a rise and daily chart close above Tuesday’s high at 7,806 and also last week’s high at 7,817 needs to occur. If exceeded on a daily chart closing basis, the UK blue chip index may resume its ascent towards the 8,000 region. ​Slips should find support along the March-to-May support line at 7,730 with the early and mid-May lows at 7,689 to 7,679 offering further potential support. A little lower sits the 38.2% Fibonacci retracement of the March advance at 7,657. While this level underpins, the medium-term uptrend from the March low remains intact.

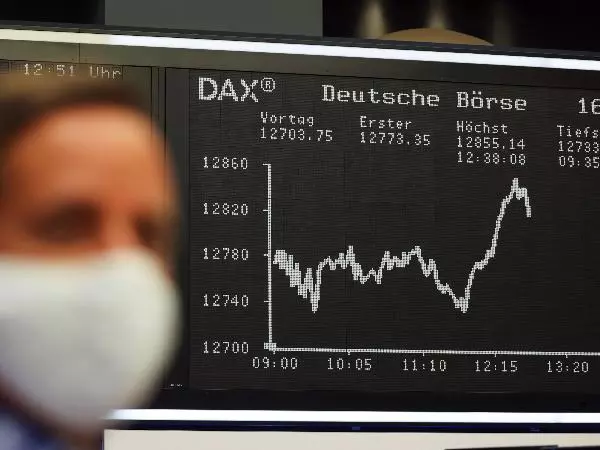
​DAX 40 trades within a whisker of its 2021 all-time record high ​

The DAX 40 got a major boost by sentiment lifting on news that the US debt ceiling is expected to be raised before the end of next week. ​The German stock index thus trades within a whisker of its November 2021 all-time record high which was made close to the 16,300 mark which remains in focus. ​Support lies between the early to mid-May highs at 16,009 to 16,005.

Source: ProRealTime

​S&P 500 trades in nine-month highs

​With a resolution to the US debt ceiling looking probable, the S&P 500 has surged higher over the past couple of days. ​The index reached levels last traded in August of last year on Thursday and is gunning for the late August high at 4,215. ​Minor support, because of inverse polarity, can be spotted at previous resistance at 4,195 to 4,187. These levels correspond to the February and early May highs. Further minor support sits between the early April and 10 May highs at 4,158 to 4,141.

Source: ProRealTime

Related articles

Live prices on most popular markets

  • Equities
  • Indices
  • Forex
  • Commodities
website terms and agreements. Prices are indicative only. All share prices are delayed by at least 15 minutes.

" >


Prices above are subject to our website terms and agreements. Prices are indicative only. All share prices are delayed by at least 15 minutes.

Prices above are subject to our website terms and agreements. Prices are indicative only. All shares prices are delayed by at least 15 mins.

Plan your trading week

Get the week’s market-moving news sent directly to your inbox every Monday. The Week Ahead gives you a full calendar of upcoming economic events, as well as commentary from our expert analysts on the key markets to watch.


You might be interested in…

Find out what charges your trades could incur with our transparent fee structure.

Discover why so many clients choose us, and what makes us a world-leading provider of spread betting and CFDs.

Stay on top of upcoming market-moving events with our customisable economic calendar.


This information has been prepared by IG, a trading name of IG Markets Limited. In addition to the disclaimer below, the material on this page does not contain a record of our trading prices, or an offer of, or solicitation for, a transaction in any financial instrument. IG accepts no responsibility for any use that may be made of these comments and for any consequences that result. No representation or warranty is given as to the accuracy or completeness of this information. Consequently any person acting on it does so entirely at their own risk. Any research provided does not have regard to the specific investment objectives, financial situation and needs of any specific person who may receive it. It has not been prepared in accordance with legal requirements designed to promote the independence of investment research and as such is considered to be a marketing communication. Although we are not specifically constrained from dealing ahead of our recommendations we do not seek to take advantage of them before they are provided to our clients. See full non-independent research disclaimer and quarterly summary.