How to trade using the Heikin Ashi candlestick
The Heikin Ashi (HA) candlestick is known for filtering out the ‘noise’ of day-to-day price fluctuations, making it a favourite among trend traders. Discover how you can incorporate HA candlesticks in your technical analysis.

What is the Heikin Ashi (HA) chart?
The Heikin Ashi (HA) is a type of price chart that uses averages to show the price movement of an asset. This chart is used as a form of technical analysis to look at an asset’s price movements with regard to an overall trend. By being able to see the overall trend more clearly, you can make a better-informed decision about whether to enter or exit a trade.
Like regular candlesticks, Heikin Ashi candles will display four different price levels (lowest point, highest point, and open and close prices), but it will use data from the current and previous session to derive their values. That being said, Heikin Ashi charts can be applied to the same time values as regular candlestick charts, making them useful as part of a scalping, day or position trading strategy.
As can be seen from the below comparison, HA charts have a smoother appearance than regular candlestick charts.

What is the Heikin Ashi formula?
The Heikin Ashi formula is the method used to calculate each candlestick on the chart. Some of the formulas or calculations are more complicated than those used for a standard candlestick. Here’s a simplified version of how to calculate the open, close, high and low for Heikin Ashi candlesticks:
- Open = (open of previous bar + close of previous bar) divided by 2
- Close = (open + close + high + low of current bar) divided by 4
- High = the maximum value from the high, open, or close of the current period
- Low = the minimum value from the low, open, or close of the current period
How to read Heikin Ashi candlesticks
When reading HA candlesticks, you should look at their wick, body and colour.
- The top of the upper wick is the highest value on the candle
- The bottom of the lower wick is the lowest value on the candle
- The body is the difference between a session’s open and close prices
- If the candle is green, the closing value is greater than the opening value, and is represented at the top of the body
- If the candle is red, the closing value is lower than the opening value and is represented at the bottom of the body

How to trade using the Heikin Ashi chart
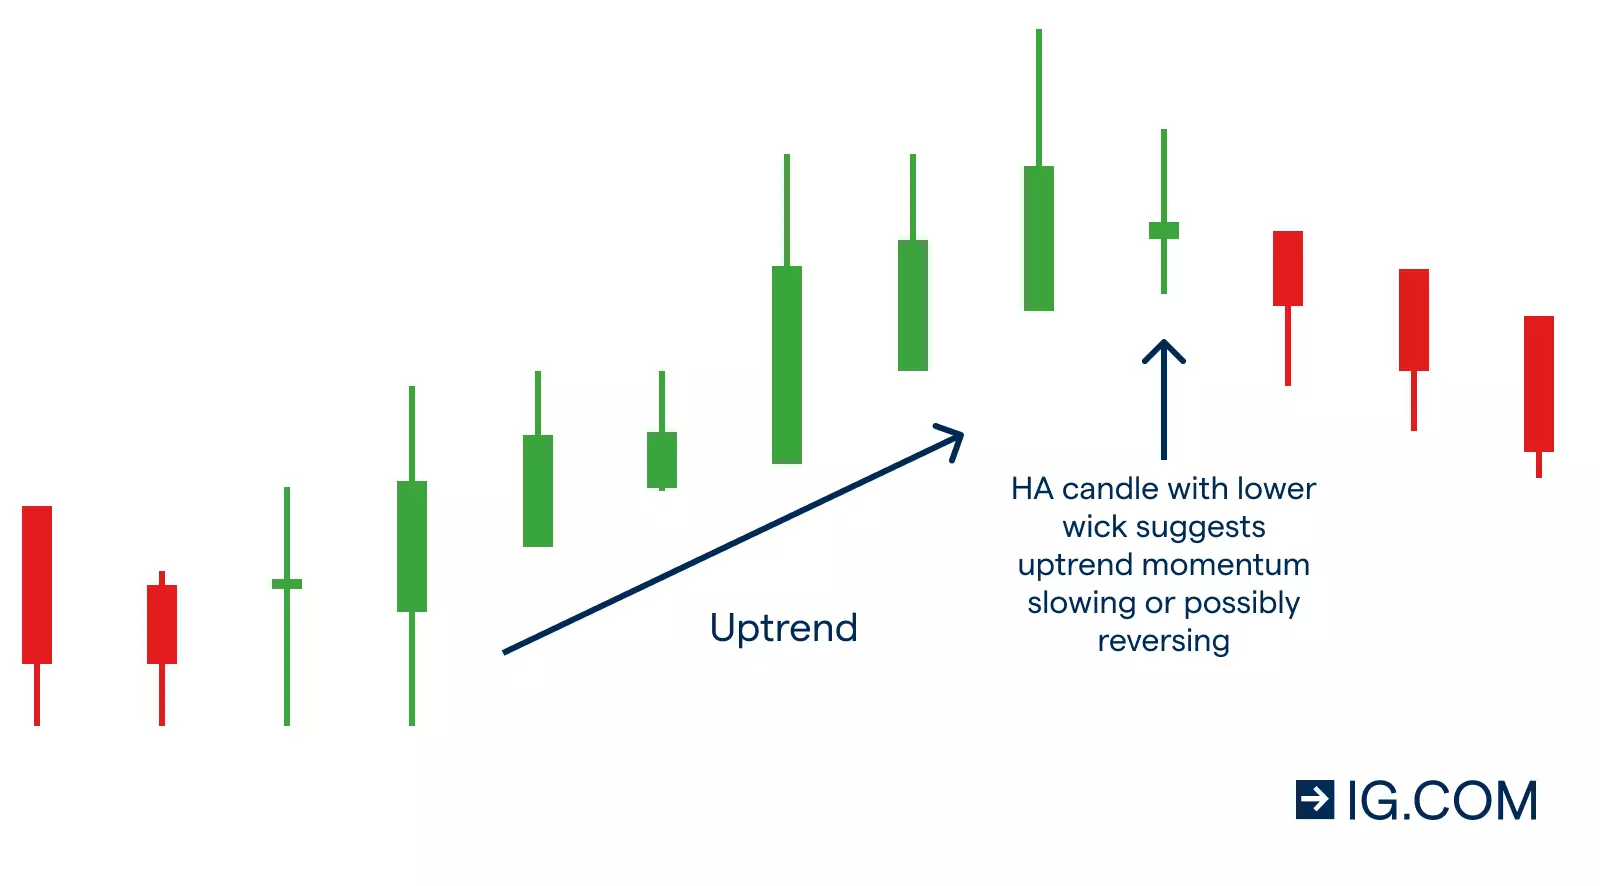
There are a few ways to trade using the Heikin Ashi chart. First, understand that each candlestick will tell you something about the price trend. For example, a long-bodied green Heikin Ashi candle with no lower wick is considered indicative of a strong upward trend. Traders who have bought into a market might use these HA signals as indications to hold on to their positions in an attempt to maximise gains in an uptrend.

The emergence of a lower wick on a Heikin Ashi candle signals that an uptrend might be losing its bullish momentum. Traders who have bought into a market might consider this as a signal to start looking to exit their respective long trades.
A long-bodied red HA candle with no upper wick is considered indicative of a strong downward trend. Traders who have shorted a market might use these HA signals as indications to hold on to their positions in an attempt to maximise gains during a bearish trend.

The emergence of an upper wick on the HA candle signals that a downtrend might be losing momentum. Traders who have shorted a market might consider this as a signal to start looking to exit their respective bearish positions.

Because HA charts show the directional market trend over the longer term, it can also be useful to apply trend indicators to identify the strength of market momentum. Then, you can trade according to the outcome of your analysis, knowing that day-to-day fluctuations have not been taken into account. The most common technical indicators to use include moving averages, the relative strength index (RSI) and the average directional index (ADX).
To trade using the Heikin Ashi chart, you can use derivatives such as spread bets or CFDs. With derivatives, you won’t take ownership of the underlying assets. Instead, you’ll be speculating on their positive or negative price movements.
Follow these steps to trade using the Heikin Ashi candlestick chart:
- Learn more about financial markets by visiting IG Academy
- Open a live trading account to put your technical analysis into action
You can practise trading with an IG demo account. You’ll be able to open and close positions in a risk-free environment with £10,000 in virtual funds.
Heikin Ashi summed up
- The Heikin Ashi (HA) chart is a type of price chart that uses daily averages to show the median price movement of an asset
- Regular candlesticks display four different price levels of an asset in a specified period, but HA candlesticks use data from the current and previous session to derive their values
- Heikin Ashi charts can be useful as part of a scalping, day or position trading strategy
- When reading HA candlesticks, the high is the highest value on the candle and the low is the lowest value on the candle
- If the candle is green, the closing value is greater than the opening value, and is represented at the top of the body
- If the candle is red, the closing value is lower than the opening value and is represented at the bottom of the body
- A long-bodied green Heikin Ashi candle with no lower wick is considered indicative of a strong bullish trend
- A long-bodied red HA candle with no upper wick is considered indicative of a strong bearish trend
- Because HA candlesticks show the directional market trend, it can also be useful to apply trend indicators (moving average, RSI and ADX) in order to identify the strength of market momentum
- To trade using the Heikin Ashi chart, you can use derivatives such as spread bets or CFDs
This information has been prepared by IG, a trading name of IG Markets Limited. In addition to the disclaimer below, the material on this page does not contain a record of our trading prices, or an offer of, or solicitation for, a transaction in any financial instrument. IG accepts no responsibility for any use that may be made of these comments and for any consequences that result. No representation or warranty is given as to the accuracy or completeness of this information. Consequently any person acting on it does so entirely at their own risk. Any research provided does not have regard to the specific investment objectives, financial situation and needs of any specific person who may receive it. It has not been prepared in accordance with legal requirements designed to promote the independence of investment research and as such is considered to be a marketing communication. Although we are not specifically constrained from dealing ahead of our recommendations we do not seek to take advantage of them before they are provided to our clients. See full non-independent research disclaimer and quarterly summary.

Discover how to trade the markets
Explore the range of markets you can trade – and learn how they work – with IG Academy's free ’introducing the financial markets’ course.