How to pick stocks
A practical guide to analysing stocks


There’s no single way to pick the “best” stocks to invest in. How investors analyse shares often depends on what they’re trying to achieve, how much risk they’re comfortable taking, and how much time and capital they have available. This guide explains how stock analysis works, the key methods investors commonly use, and the factors that are typically considered when choosing shares.
Key Takeaways
- There is no single method for picking stocks
- Fundamental and technical analysis provide different perspectives
- Valuation reflects both data and market sentiment
- Risk management and planning are central considerations
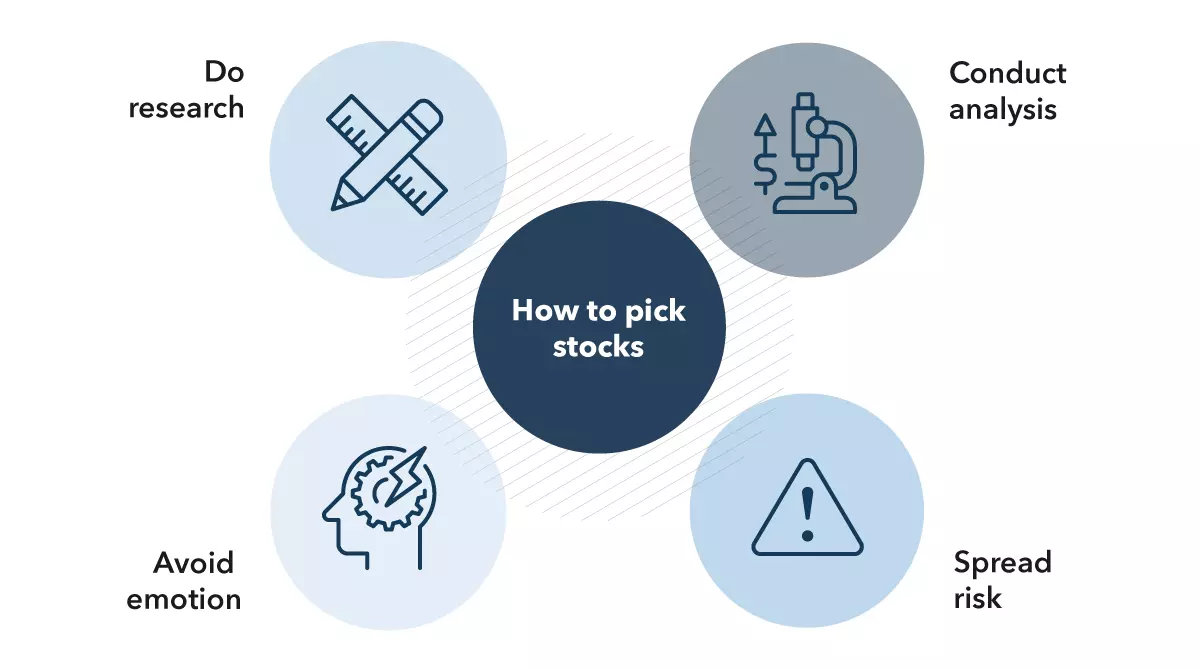
How to pick stocks: key principles
When researching shares, investors often start by clarifying a few basics:
- Objectives — such as income, long-term growth, or shorter-term trading
- Risk tolerance — how much volatility or potential loss they’re comfortable with
- Time horizon — whether positions may be held for days, months, or years
Some investors choose to access markets through investment accounts, such as ISAs or SIPPs, while others focus on taxable investment accounts depending on their circumstances. You can explore different ways to invest via IG’s range of investment options.
Rather than relying solely on hype or market sentiment, many investors use structured analysis to inform their decisions and help avoid emotional reactions to price movements.
Ready to start investing?
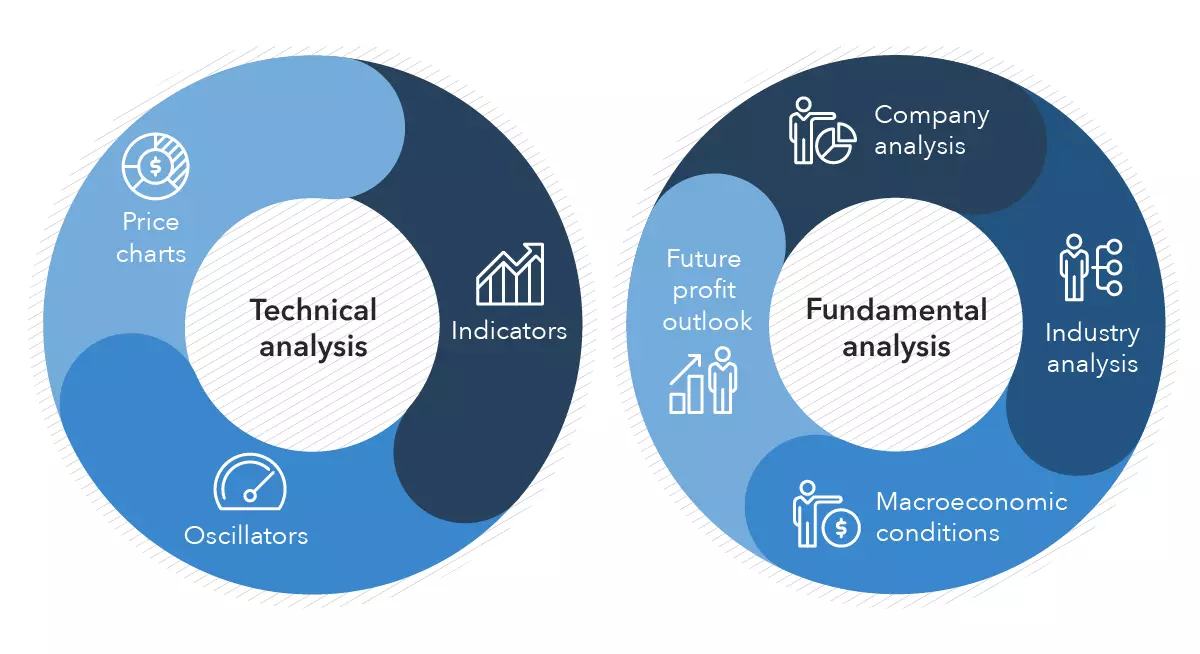
Fundamental analysis explained
Fundamental analysis focuses on estimating a company’s intrinsic value by examining its financial position, performance, and wider economic context. This approach considers both qualitative and quantitative information.
Qualitative factors in fundamental stock analysis
Qualitative factors are non-numerical aspects that can influence how a company is perceived.
- Company news — Announcements such as product launches, regulatory developments, or legal issues can influence investor sentiment and share prices.
- Management and personnel changes — Changes in leadership or governance structures may affect confidence in a company’s long-term direction.
- Wider economic and political events — Interest rate decisions, inflation data, elections, and geopolitical events can introduce uncertainty and volatility across markets.
Quantitative factors used to analyse stocks
Quantitative analysis uses financial data to assess performance and valuation.
- Earnings — Earnings reports can provide insight into profitability, though results may vary over time.
- Balance sheets — A balance sheet outlines a company’s assets and liabilities, which some investors review to assess financial resilience.
- Dividends — Dividends are distributions from company profits to shareholders. Not all companies pay dividends, and payments can be reduced or withdrawn.
Common fundamental analysis ratios
Ratios are often used to compare companies within the same sector, though their usefulness can vary by industry.
- Price-to-earnings (P/E) ratio
- Debt-to-equity (D/E) ratio
- Return on equity (ROE)
- Earnings yield
- Dividend yield
- Current ratio
- PEG ratio
- Price-to-book (P/B) ratio
Ratios should be interpreted alongside broader financial and market context.
Top-down vs bottom-up analysis
There are two commonly used frameworks within fundamental analysis.
Top-down analysis: This approach starts with macroeconomic factors such as GDP growth, inflation, interest rates, and sector performance before narrowing down to individual companies.
Bottom-up analysis: Bottom-up analysis focuses on company-specific data, comparing financial performance, products, and management with competitors.
Neither approach guarantees outcomes, and suitability often depends on an investor’s experience and objectives.
Technical analysis explained
Technical analysis examines price data and trading volume, rather than company fundamentals. The aim is to identify trends, momentum, and potential areas of support or resistance.
Technical analysis is commonly used by traders with shorter time horizons, though some investors use it alongside fundamental research.
Common technical indicators
Some widely used technical tools include:
- Moving averages (MA and EMA)
- Relative strength index (RSI)
- MACD
- Bollinger Bands
- Stochastic oscillator
- Fibonacci retracement
- Ichimoku Cloud
Technical indicators do not predict market movements and are typically used as part of a broader analytical approach.
Fundamental vs technical analysis: which is better?
Fundamental and technical analysis serve different purposes. Fundamental analysis focuses on financial and economic factors, while technical analysis looks at price behaviour.
Many market participants use both approaches together, depending on their strategy, timeframe, and risk tolerance.
What makes a stock valuable?
A share’s market price reflects supply and demand, shaped by expectations, sentiment, and available information.
Some investors use valuation methods to assess whether a stock is undervalued or overvalued based on financial data, though market prices can change for many reasons.
How to identify undervalued and overvalued stocks
Identifying undervalued or overvalued stocks typically involves combining:
- Fundamental analysis (financial data and ratios)
- Technical analysis (price trends and momentum)
Rather than focusing on whether a stock looks cheap or expensive, analysis often centres on whether its price reflects available information at a given time.
Ways to take a position on stocks
There are different ways to gain exposure to shares, depending on whether you want to own the underlying asset.
- Investing in shares — Buying shares through a share dealing account means owning the stock outright. Returns depend on share price movements and any dividends paid.
Learn more about opening a share dealing account with IG today.
- Trading via derivatives — Some investors and traders choose derivatives such as CFDs or spread bets to speculate on price movements without owning the underlying shares. These products involve leverage, which can amplify both gains and losses.
Explore the range of shares available on IG’s platform.
What to bear in mind when choosing stocks
Create a trading or investing plan
A plan typically outlines goals, time horizon, and risk limits.
Understand the market
Share prices are influenced by economic conditions, interest rates, sector trends, and market sentiment.
Use screening tools
Market screeners can help compare shares using selected criteria, though outputs should be interpreted carefully.
Manage risk
All markets involve risk. Diversification and position sizing are commonly used to help manage exposure.
Some investors also consider tax-efficient wrappers, such as ISAs or SIPPs, when investing in shares, depending on eligibility and individual circumstances.
Others may diversify exposure using different instruments, such as ETFs.
Quick fact
Tax laws are subject to change and differ by country. Always seek the most up-to-date information.
How to pick stocks summed up
Picking stocks involves understanding how shares are analysed, rather than trying to predict market movements or identify guaranteed outcomes. Fundamental and technical analysis offer different ways to assess companies and price behaviour, while factors such as risk tolerance, time horizon, and diversification play an important role in decision-making.
By approaching stock selection in a structured and informed way, investors can better understand the opportunities and risks involved in participating in share markets.
FAQs
Is there a “best” way to pick stocks?
There is no single best method. Investors often use a combination of fundamental and technical analysis, along with risk management, based on their goals and experience.
Is fundamental analysis better than technical analysis?
Neither approach is inherently better. Fundamental analysis focuses on financial and economic factors, while technical analysis examines price behaviour. Many people use both.
Can beginners use technical indicators?
Some beginners choose to learn basic technical indicators, though understanding their limitations and context is important.
Do dividends make a stock safer?
Dividends can provide income, but they are not guaranteed. Companies can reduce or cancel dividend payments at any time.
Are undervalued stocks always good investments?
Not necessarily. A stock may appear undervalued for many reasons, including changes to a company’s outlook or wider market conditions.
Important to know
This information has been prepared by IG, a trading name of IG Markets Limited. In addition to the disclaimer below, the material on this page does not contain a record of our trading prices, or an offer of, or solicitation for, a transaction in any financial instrument. IG accepts no responsibility for any use that may be made of these comments and for any consequences that result. No representation or warranty is given as to the accuracy or completeness of this information. Consequently any person acting on it does so entirely at their own risk. Any research provided does not have regard to the specific investment objectives, financial situation and needs of any specific person who may receive it. It has not been prepared in accordance with legal requirements designed to promote the independence of investment research and as such is considered to be a marketing communication. Although we are not specifically constrained from dealing ahead of our recommendations we do not seek to take advantage of them before they are provided to our clients. See full non-independent research disclaimer and quarterly summary.
Connect with us
Spread bets and CFDs are complex instruments and come with a high risk of losing money rapidly due to leverage. 69% of retail investor accounts lose money when trading spread bets and CFDs with this provider. You should consider whether you understand how spread bets and CFDs work and whether you can afford to take the high risk of losing your money.
Professional clients trading spread bets and CFDs can lose more than they deposit.
The value of shares, ETFs and other ETPs bought through a share dealing account, a stocks and shares ISA or a SIPP can fall as well as rise, which could mean getting back less than you originally put in. Past performance is no guarantee of future results. Some ETPs carry additional risks depending on how they’re structured, investors should ensure they familiarise themselves with the differences before investing.
Crypto - Don’t invest unless you’re prepared to lose all the money you invest. This is a high-risk investment, and you should not expect to be protected if something goes wrong. Take 2 mins to learn more.
Share dealing and IG Smart Portfolio accounts provided by IG Trading and Investments Ltd, CFD accounts are provided by IG Markets Ltd, spread betting provided by IG Index Ltd, cryptoassets services are provided by IG Digital Assets Ltd.
IG is a trading name of IG Trading and Investments Ltd (a company registered in England and Wales under number 11628764), IG Markets Ltd (a company registered in England and Wales under number 04008957) and IG Index Ltd (a company registered in England and Wales under number 01190902). Registered address at Cannon Bridge House, 25 Dowgate Hill, London EC4R 2YA. IG Markets Ltd (Register number 195355), IG Trading and Investments Ltd (Register Number 944492) and IG Index Ltd (Register number 114059) are authorised and regulated by the Financial Conduct Authority.
The information on this site isn’t directed at residents of the United States, Belgium or any particular country outside the UK and isn’t intended for distribution to, or use by, any person in any country or jurisdiction where such distribution or use would be contrary to local law or regulation.