EUR/USD rise crippled by strong US inflation data, EUR/GBP and GBP/JPY weaker
EUR/USD, EUR/GBP and GBP/JPY under pressure post 40-year high in US inflation.

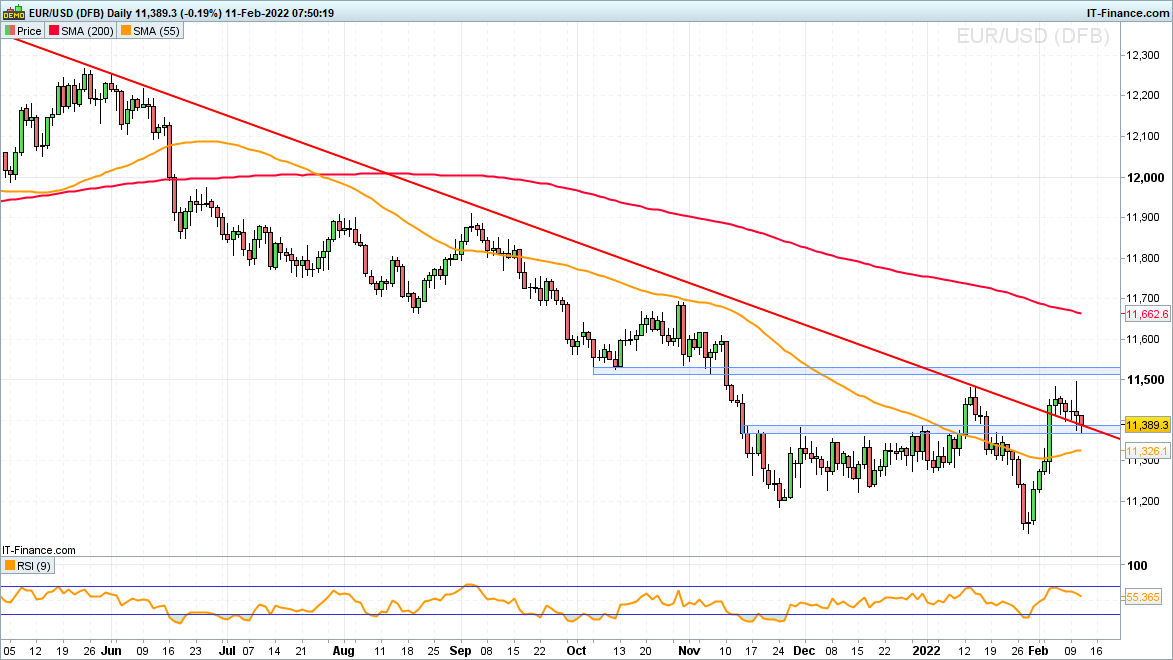
EUR/USD once again weighs on its support line and is likely to slide further
Yesterday EUR/USD briefly shot up to a three-month high at $1.1495 before US consumer price index (CPI) data came in well above market forecasts of 7.3% at a 40-year high of 7.5% in January of 2022, reversing the currency pair’s uptrend.
EUR/USD thus did a fourth ‘return to point of breakout’ in as many days by slipping to the breached 2021-to-2022 downtrend line and 20 January high at $1.1389 to $1.1369. In case of further downside being witnessed, the 55-day moving average (MA) at $1.1326 would be targeted.
The January and current February highs at $1.1482 to $1.1495 now offer solid resistance.
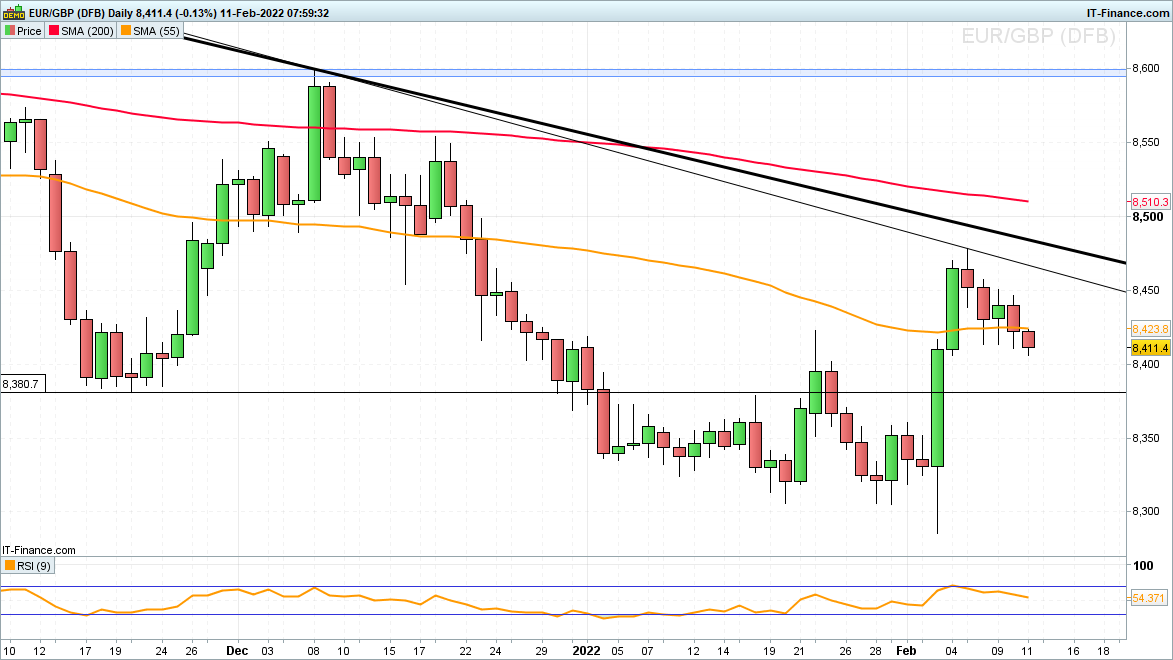
EUR/GBP is likely to decline further still
EUR/GBP now trades below the 55-day simple moving average (SMA) at £0.8424 with it slipping back towards the £0.84 mark and the November trough at £0.8381 on slightly better than expected UK month-on-month gross domestic product (GDP) and industrial production data.
Immediate resistance can be spotted at the £0.8422 late January high and above it at the mid-January £0.8454 low.
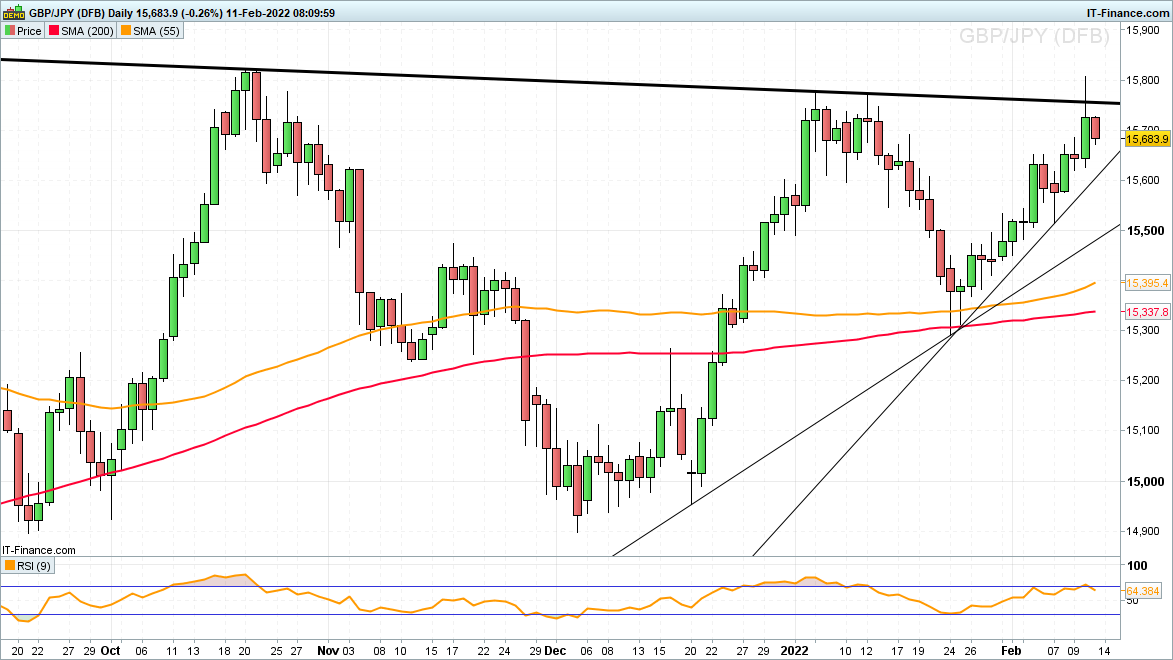
GBP/JPY rally stalls at the October peak
Yesterday GBP/JPY broke through its four-month resistance line at ¥157.55 and briefly rose above the January peak at ¥157.77, close to the October high at ¥158.22 which provoked failure, though.
Despite today’s pullback, the late January uptrend remains intact. A rise above the October high at ¥158.22 would push GBP/JPY to a 5 ½ year high and open the way for major resistance at ¥162.61 to ¥163.87 to be reached. It encompasses the June and August 2009 highs, February 2014 low and the March as well as May 2016 highs and as such may stall the advance when first tested.
Overall bullish pressure should be maintained, while the early February high and one-month support line at ¥156.51 to ¥156.05 underpin.
This information has been prepared by IG, a trading name of IG Markets Limited. In addition to the disclaimer below, the material on this page does not contain a record of our trading prices, or an offer of, or solicitation for, a transaction in any financial instrument. IG accepts no responsibility for any use that may be made of these comments and for any consequences that result. No representation or warranty is given as to the accuracy or completeness of this information. Consequently any person acting on it does so entirely at their own risk. Any research provided does not have regard to the specific investment objectives, financial situation and needs of any specific person who may receive it. It has not been prepared in accordance with legal requirements designed to promote the independence of investment research and as such is considered to be a marketing communication. Although we are not specifically constrained from dealing ahead of our recommendations we do not seek to take advantage of them before they are provided to our clients. See full non-independent research disclaimer and quarterly summary.

Start trading forex today
Find opportunity on the world’s most-traded – and most-volatile – financial market.
- Trade spreads from just 0.6 points on EUR/USD
- Analyse with clear, fast charts
- Speculate wherever you are with our intuitive mobile apps
See an FX opportunity?
Try a risk-free trade in your demo account, and see whether you’re onto something.
- Log in to your demo
- Take your position
- See whether your hunch pays off
See an FX opportunity?
Don’t miss your chance – upgrade to a live account to take advantage.
- Get spreads from just 0.6 points on popular pairs
- Analyse and deal seamlessly on fast, intuitive charts
- See and react to breaking news in-platform
See an FX opportunity?
Don’t miss your chance. Log in to take your position.
Live prices on most popular markets
- Equities
- Indices
- Forex
- Commodities
Prices above are subject to our website terms and agreements. Prices are indicative only. All share prices are delayed by at least 15 minutes.
Prices above are subject to our website terms and agreements. Prices are indicative only. All shares prices are delayed by at least 15 mins.