Dow and Nikkei 225 rally, but Hang Seng slips lower again
Falling inflation expectations and Saudi Arabia’s move to cut export prices for oil meant that equities have finally found their footing after a difficult start to the year. However the Hang Seng falls once again.

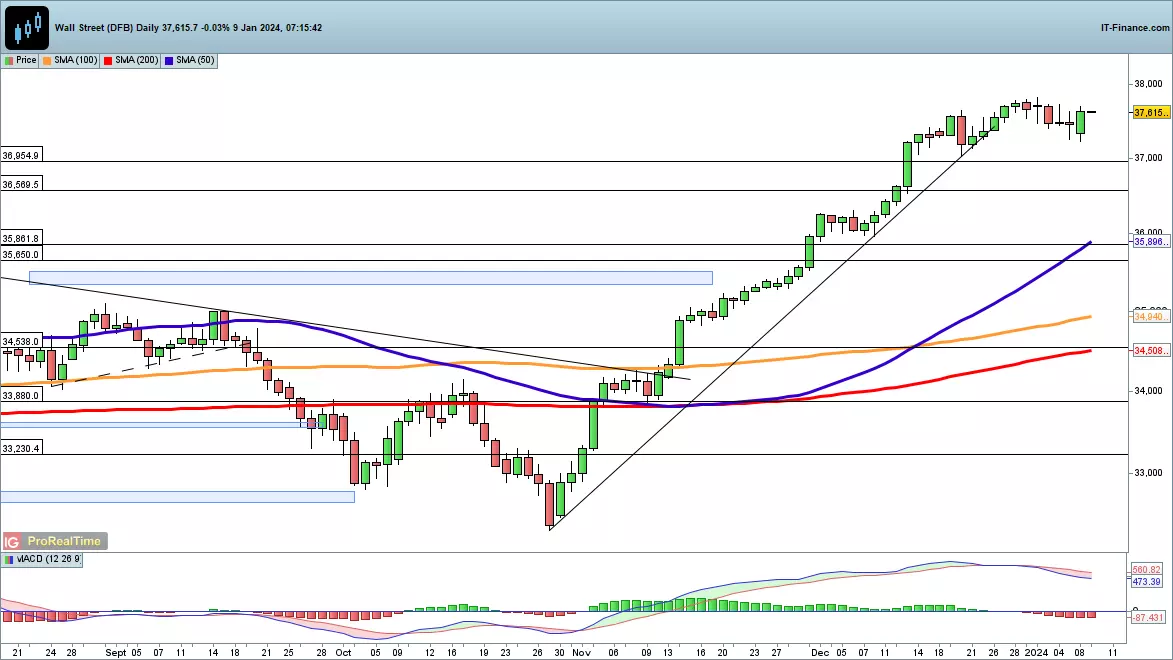
Dow rallies once more
Monday saw the index rebound from the lows of the session, clawing back losses from the final two sessions of last week.
A push to new record highs may well now develop, and beyond this the 38,000 level comes into view. This cancels out a short-term negative view and revives the uptrend, albeit at a potentially overextended level.
A reversal back below 37,250 would be needed to revive the short-term negative view.
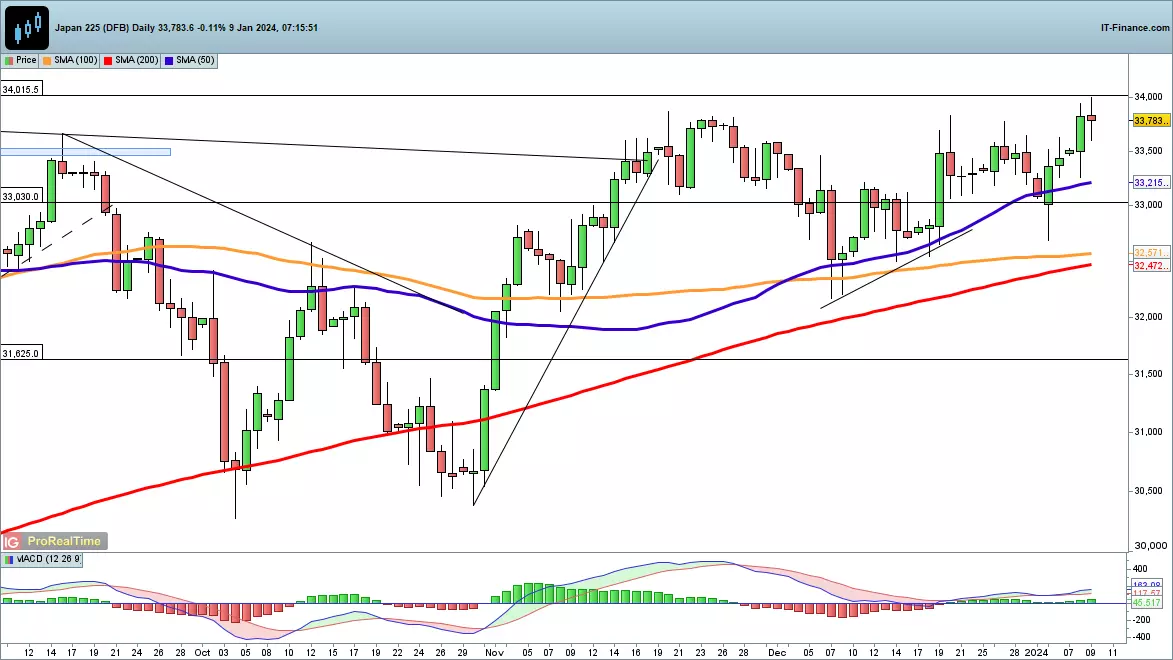
Nikkei 225 testing recent highs
Further gains on Monday helped to lift the index back to the November highs, and now a test of 34,000 seems to beckon.
A move above 34,000 would put the index at its highest levels since 1989, and would mark the end of the extended consolidation period for the index that has been in place since the end of June.
Since last week’s low the price has gained over 3%, and it would need a close back below 33,000 to put the sellers back in charge in the short-term.
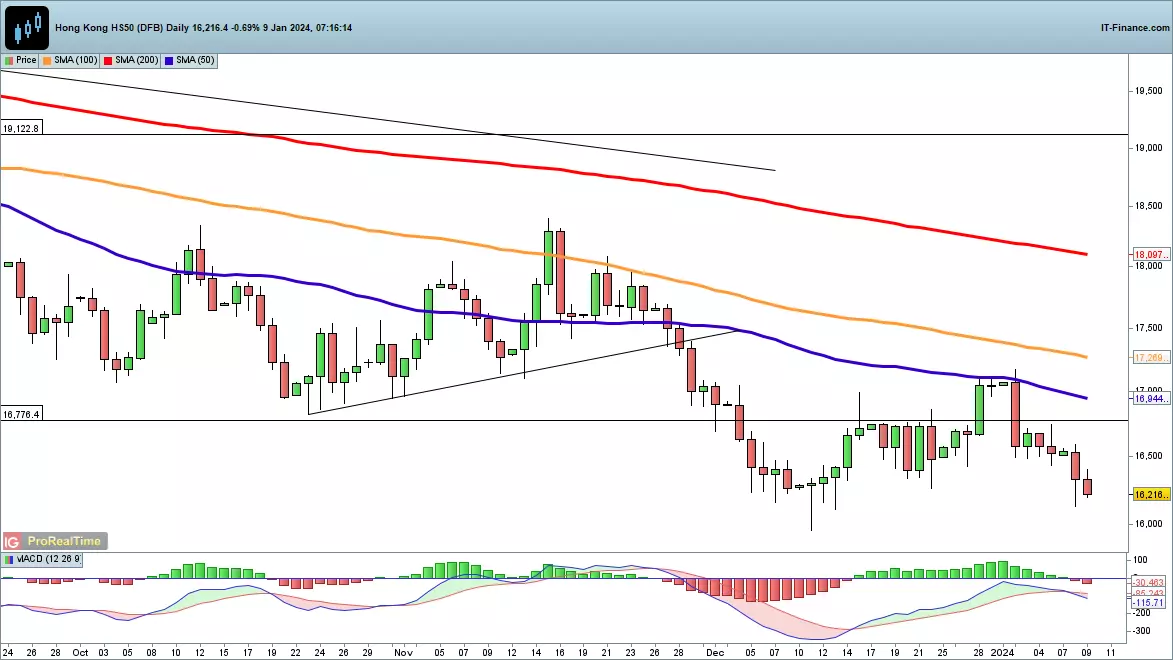
Hang Seng back on a downward path
This index has resumed its downward move, after the brief rebound in late December.
Gains faltered at the 50-day simple moving average (SMA), resulting in a textbook reversal that has taken the index back towards the December lows, the lowest level since November 2022. Further declines head towards the November low at 14,640.
A revival above the 50-day SMA and 17,170, the highs of last week, would be needed to suggest a short-term rebound has begun.
This information has been prepared by IG, a trading name of IG Markets Limited. In addition to the disclaimer below, the material on this page does not contain a record of our trading prices, or an offer of, or solicitation for, a transaction in any financial instrument. IG accepts no responsibility for any use that may be made of these comments and for any consequences that result. No representation or warranty is given as to the accuracy or completeness of this information. Consequently any person acting on it does so entirely at their own risk. Any research provided does not have regard to the specific investment objectives, financial situation and needs of any specific person who may receive it. It has not been prepared in accordance with legal requirements designed to promote the independence of investment research and as such is considered to be a marketing communication. Although we are not specifically constrained from dealing ahead of our recommendations we do not seek to take advantage of them before they are provided to our clients. See full non-independent research disclaimer and quarterly summary.

Seize your opportunity
Deal on the world’s stock indices today.
- Trade on rising or falling markets
- Get one-point spreads on the FTSE 100
- Unrivalled 24-hour pricing
See opportunity on an index?
Try a risk-free trade in your demo account, and see whether you’re on to something.
- Log in to your demo
- Try a risk-free trade
- See whether your hunch pays off
See opportunity on an index?
Don’t miss your chance – upgrade to a live account to take advantage.
- Get spreads from one point on the FTSE 100
- Trade more 24-hour indices than any other provider
- Analyse and deal seamlessly on smart, fast charts
See opportunity on an index?
Don’t miss your chance. Log in to take your position.
Live prices on most popular markets
- Equities
- Indices
- Forex
- Commodities
Prices above are subject to our website terms and agreements. Prices are indicative only. All share prices are delayed by at least 15 minutes.
Prices above are subject to our website terms and agreements. Prices are indicative only. All shares prices are delayed by at least 15 mins.