All eyes on upcoming FOMC meeting outcome: Nasdaq 100, Straits Times Index, USD/CAD
With the FOMC meeting underway, the release of US economic data overnight has supported market hopes of potentially seeing the Fed easing up on its rate hike path.
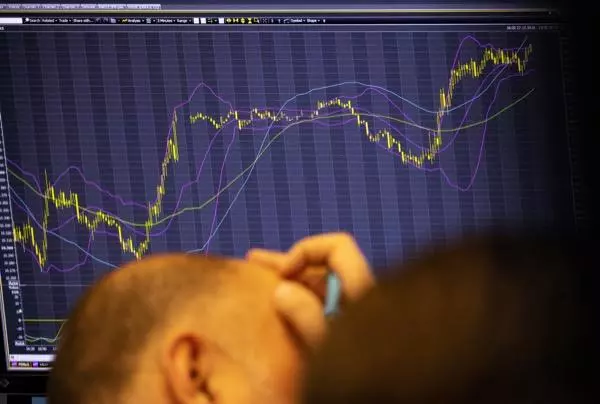

Market Recap
With the Federal Open Market Committee (FOMC) meeting underway, the release of US economic data overnight has supported market hopes of potentially seeing the Federal Reserve (Fed) easing up on its rate hike path. The US quarter four (Q4) employment cost index, which the Fed watches closely for signs of wage inflation, provided a slight downside surprise (1.0% versus 1.1% expected) and added to the list of recent inflation indicators pointing to moderating pricing pressures. Other economic data releases also showed that the US housing market and consumer confidence are reacting to the series of aggressive rate hikes enacted by the Fed thus far, which may be in line with what the central bank wants to see to keep inflation under check. Surge in mortgage rates resulted in a sharp drop in home buyer demand, while US consumer confidence in January fell more than expected (107.1 versus 109 expected). Now, all eyes will be up to the Fed to confirm recent market optimism, which could see central bankers staying firm on keeping inflation down but continue to emphasise on a data-dependent stance in making future rate decisions.
Initial upmove in the US dollar was met with some paring of gains, but continue to hold above its 101.30 level of support thus far. Greater reaction could be in gold prices, which saw heavy dip-buying to form a bullish pin bar. The improved risk sentiments were also brought on by positive earnings and corporate guidance, such as General Motors, Exxon Mobil, UPS and Spotify just to name a few. With some dip-buying seen last night for the Nasdaq 100 index, the 12,200 level continues to be eyed for a break. The index continues to defend its 200-day moving average (MA) after breaking above it for the first time since January 2022. Any move above the 12,200 level could leave the 13,000 level on watch next.

Asia Open
Asian stocks look set for a positive open, with Nikkei +0.62%, ASX +0.60% and KOSPI +0.74% at the time of writing. Risk sentiments in the region could tap on the positive handover from Wall Street but upside could still be somewhat contained with a lingering tone of caution ahead of the US FOMC meeting outcome. The Nasdaq Golden Dragon China Index eked out a muted close (-0.14%) overnight while US equity futures this morning are slightly down. Economic data releases this morning displayed an uptick in New Zealand’s unemployment rate to 3.4% from previous 3.3%, but still-resilient reading continues to support a 50 basis-point hike in February before subsequent downshifts. On another note, South Korea’s exports in January provided another sign of a quicker moderation in global economic conditions, contracting far quicker than expected at 16.6% (-11.3% consensus). Nevertheless, losses in reaction to the softer data has been overcome by market optimism for central banks to ease on their rate hikes ahead, with the KOSPI sitting above its 200-day MA for the first time since September 2021.
The Straits Times Index continues to defend its 3,370 level for now, which marks a key 76.4% Fibonacci retracement level. Staying above this level could set its sight on the 3,490 level next, which seemingly marks a double-top pattern back in early-2022. On a longer-term timeframe, the 3,490 level also points to a peak in 2015 and 2018 on the monthly chart, leaving it as a key resistance to overcome ahead.

On the watchlist: USD/CAD failed to reclaim upward trendline
An attempt for the USD/CAD to move back above an upward trendline resistance this week was met with a strong bearish rejection as earlier gains were erased sharply. The downside reaction in the pair followed after the concurrent release of Canada’s GDP reading and further moderation in US employment cost pressures presented in Q4 (1% versus previous 1.3%). Some renewed gain in oil prices likely played a part as well to deliver some downward pressure, along with the improved risk environment overnight. Failure to reclaim the upward trendline could provide a bearish bias for the USD/CAD, which may leave the 1.322 level on watch next. This marks its November low, where a key 38.2% Fibonacci retracement level resides. Resistance remains at the 1.350 level.

Tuesday: DJIA +1.09%; S&P 500 +1.46%; Nasdaq +1.67%, DAX +0.01%, FTSE -0.17%
This information has been prepared by IG, a trading name of IG Markets Limited. In addition to the disclaimer below, the material on this page does not contain a record of our trading prices, or an offer of, or solicitation for, a transaction in any financial instrument. IG accepts no responsibility for any use that may be made of these comments and for any consequences that result. No representation or warranty is given as to the accuracy or completeness of this information. Consequently any person acting on it does so entirely at their own risk. Any research provided does not have regard to the specific investment objectives, financial situation and needs of any specific person who may receive it. It has not been prepared in accordance with legal requirements designed to promote the independence of investment research and as such is considered to be a marketing communication. Although we are not specifically constrained from dealing ahead of our recommendations we do not seek to take advantage of them before they are provided to our clients. See full non-independent research disclaimer and quarterly summary.

Act on share opportunities today
Go long or short on thousands of international stocks with spread bets and CFDs.
- Get full exposure for a comparatively small deposit
- Trade on spreads from just 0.1%
- Get greater order book visibility with direct market access
See opportunity on a stock?
Try a risk-free trade in your demo account, and see whether you’re on to something.
- Log in to your demo
- Take your position
- See whether your hunch pays off
See opportunity on a stock?
Don’t miss your chance – upgrade to a live account to take advantage.
- Trade a huge range of popular stocks
- Analyse and deal seamlessly on fast, intuitive charts
- See and react to breaking news in-platform
See opportunity on a stock?
Don’t miss your chance. Log in to take advantage while conditions prevail.
Live prices on most popular markets
- Equities
- Indices
- Forex
- Commodities
Prices above are subject to our website terms and agreements. Prices are indicative only. All share prices are delayed by at least 15 minutes.
Prices above are subject to our website terms and agreements. Prices are indicative only. All shares prices are delayed by at least 15 mins.