Is now the right time to ‘buy the dip’ in stock markets?
With most European and US stock indices having slid around 5% from their record highs, is now the right time to buy the dip?


Is the stock market correction coming to an end?
Heightened tensions in the Middle East and pared back rate cut expectations amid worries of sticky inflation provoked a 4.5% to 5.5% drop in most European and US stock markets from their record highs.
However, long-term investors may want to consider taking advantage of this dip to add high-quality stocks trading at lower prices. Here are some reasons why now could be a good entry point:
Stocks are cheaper than they were a month ago. The recent sell-off means stocks across most sectors are trading at 5-10% discounts compared to March 2024. Many strong companies are now available at slightly more reasonable valuations.
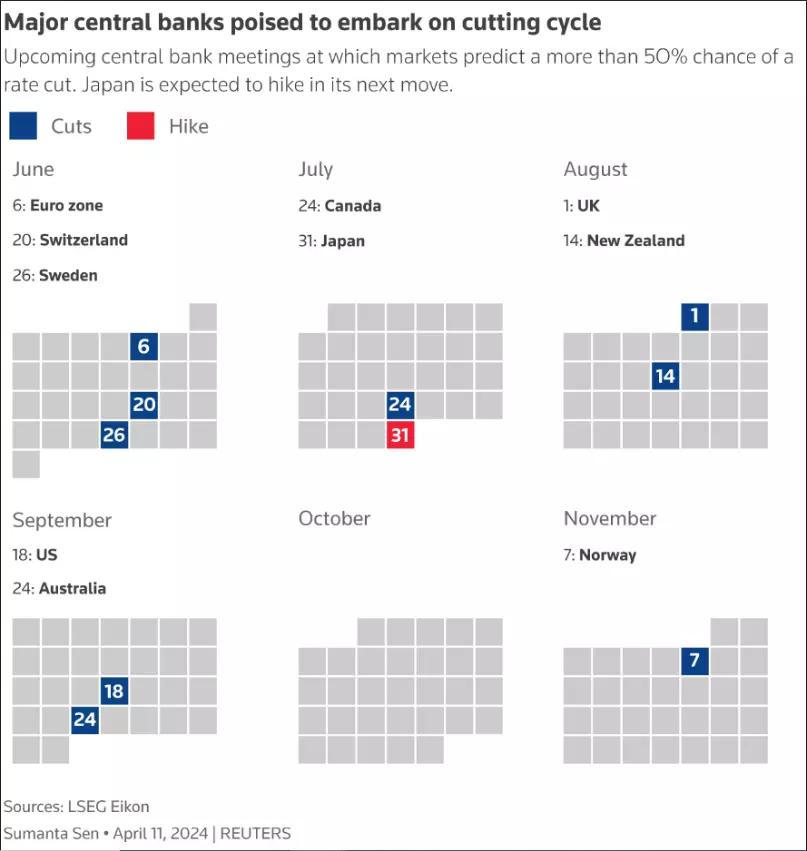
Interest rates have almost certainly reached their peak and its now not a question of if but when they will be cut. Despite the Federal Reserve (Fed) aggressively raising rates to fight inflation, the US economy has remained robust and has been accompanied by a solid labour market. Inflation is cooling, even if recent data has shown that this process is not linear and that there are some bumps on the way. Falling inflation and rate cuts should provide support for equity prices.
Several European and US indices have reached potential support zones from which they may, at least over the coming days, recover.
S&P 500 daily candlestick chart
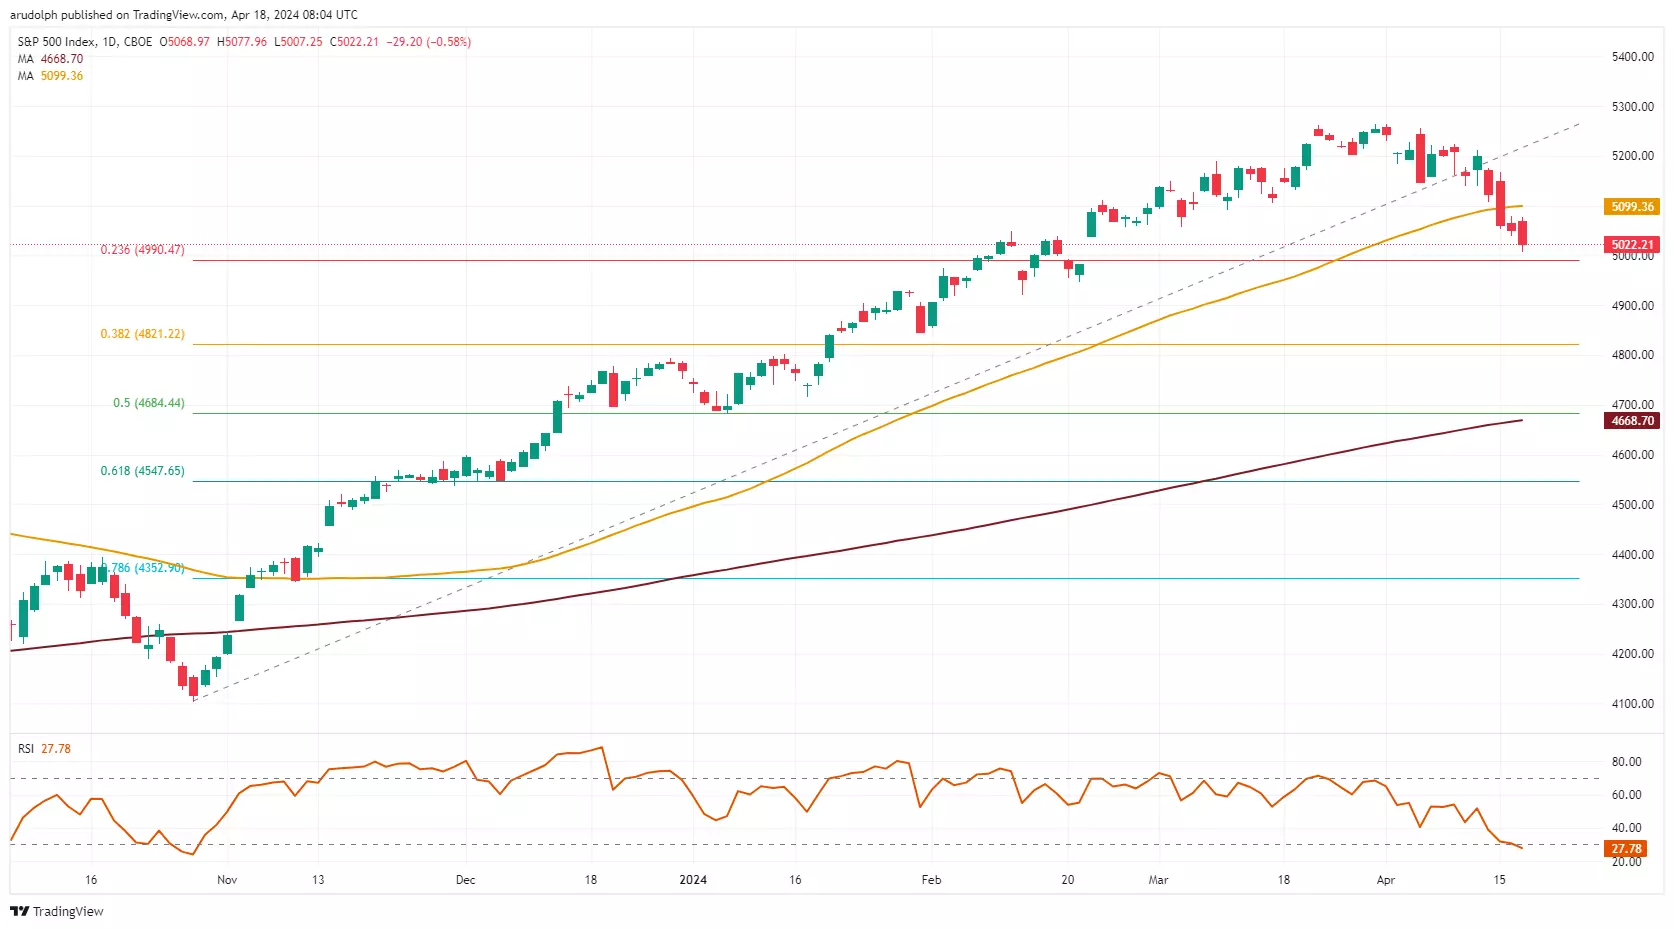
The S&P 500, for example, after four consecutive days of falling prices, is trading towards the upper boundary of its 5,048 to 4,920 February sideways trading range, close to the psychological 5,000 mark and the 23.6% Fibonacci retracement of the October-to-March advance at 4,990.5, all of which may act as support from which another up leg may be formed.
Then again, if this support zone were give way, possibly because of escalation in the Middle East or disappointing US first quarter Q1 earnings, the 38.2% Fibonacci retracement and December peak at 4,821 to 4,793 may be back in play.
From a seasonality point of view such a scenario looks probable since, going back to 1928, the month of May seems to be the worst performing month for the S&P 500 in US presidential election years such as this year’s.
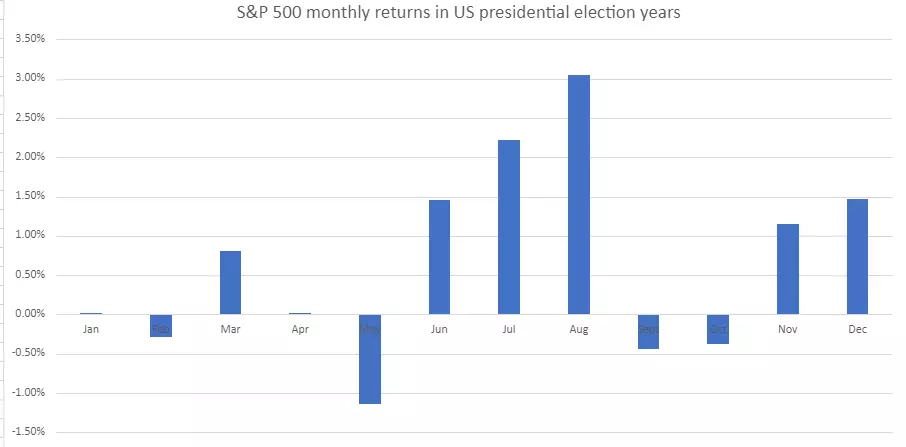
Having said that, June to-August followed by November to December of presidential election years tend to see stock price rises.
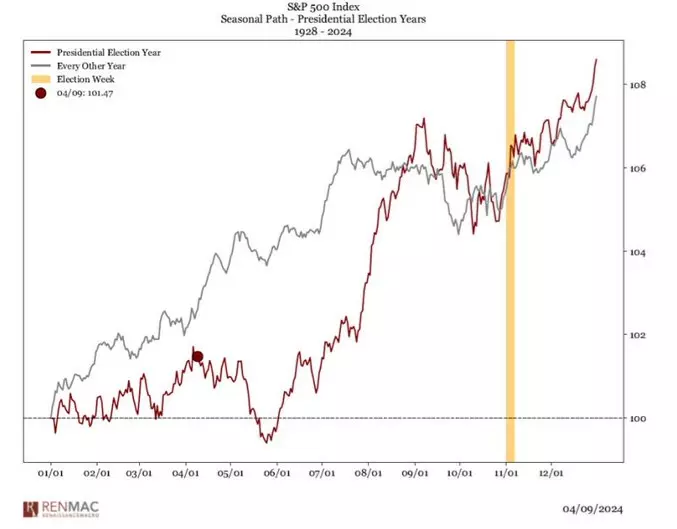
S&P 500 seasonal path in US presidential election years chart
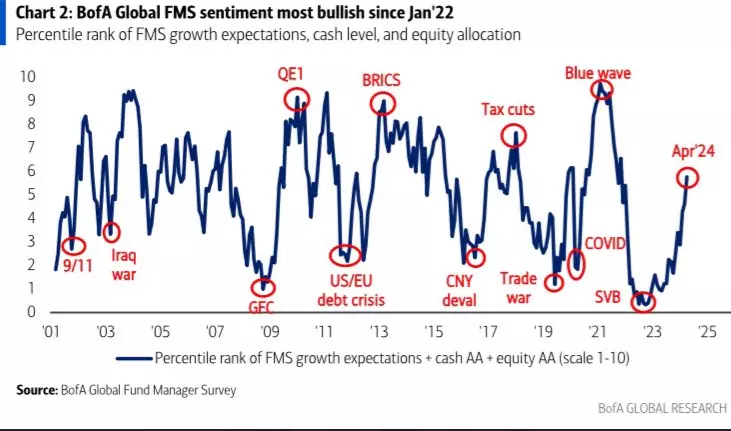
At a time at which global fund managers sentiment is the most bullish since January 2022, a minor correction such as the one we are in at the moment, is to be expected and nothing out of the ordinary. The question is whether stock markets on both sides of the Atlantic may drop another 5% before they resume their ascents or whether the current dip already marks the end of the corrective phase.
In the short term, we may see continued turbulence until inflation and geopolitical tensions ease. However, for long-term investors, the recent dip likely provides an opportunity to buy stocks at cheaper values. The key is taking a patient approach and not getting shaken out by normal stock market corrections.
As the economic and geopolitical backdrop improves, today's stock prices could look like bargains in hindsight and this despite this year’s already impressive gains.
This information has been prepared by IG, a trading name of IG Markets Limited. In addition to the disclaimer below, the material on this page does not contain a record of our trading prices, or an offer of, or solicitation for, a transaction in any financial instrument. IG accepts no responsibility for any use that may be made of these comments and for any consequences that result. No representation or warranty is given as to the accuracy or completeness of this information. Consequently any person acting on it does so entirely at their own risk. Any research provided does not have regard to the specific investment objectives, financial situation and needs of any specific person who may receive it. It has not been prepared in accordance with legal requirements designed to promote the independence of investment research and as such is considered to be a marketing communication. Although we are not specifically constrained from dealing ahead of our recommendations we do not seek to take advantage of them before they are provided to our clients. See full non-independent research disclaimer and quarterly summary.

Act on share opportunities today
Go long or short on thousands of international stocks with spread bets and CFDs.
- Get full exposure for a comparatively small deposit
- Trade on spreads from just 0.1%
- Get greater order book visibility with direct market access
See opportunity on a stock?
Try a risk-free trade in your demo account, and see whether you’re on to something.
- Log in to your demo
- Take your position
- See whether your hunch pays off
See opportunity on a stock?
Don’t miss your chance – upgrade to a live account to take advantage.
- Trade a huge range of popular stocks
- Analyse and deal seamlessly on fast, intuitive charts
- See and react to breaking news in-platform
See opportunity on a stock?
Don’t miss your chance. Log in to take advantage while conditions prevail.
Live prices on most popular markets
- Equities
- Indices
- Forex
- Commodities
Prices above are subject to our website terms and agreements. Prices are indicative only. All share prices are delayed by at least 15 minutes.
Prices above are subject to our website terms and agreements. Prices are indicative only. All shares prices are delayed by at least 15 mins.