EUR/USD stalls while GBP/USD and USD/JPY push higher
Outlook on EUR/USD, GBP/USD and USD/JPY amid recovering US yields.


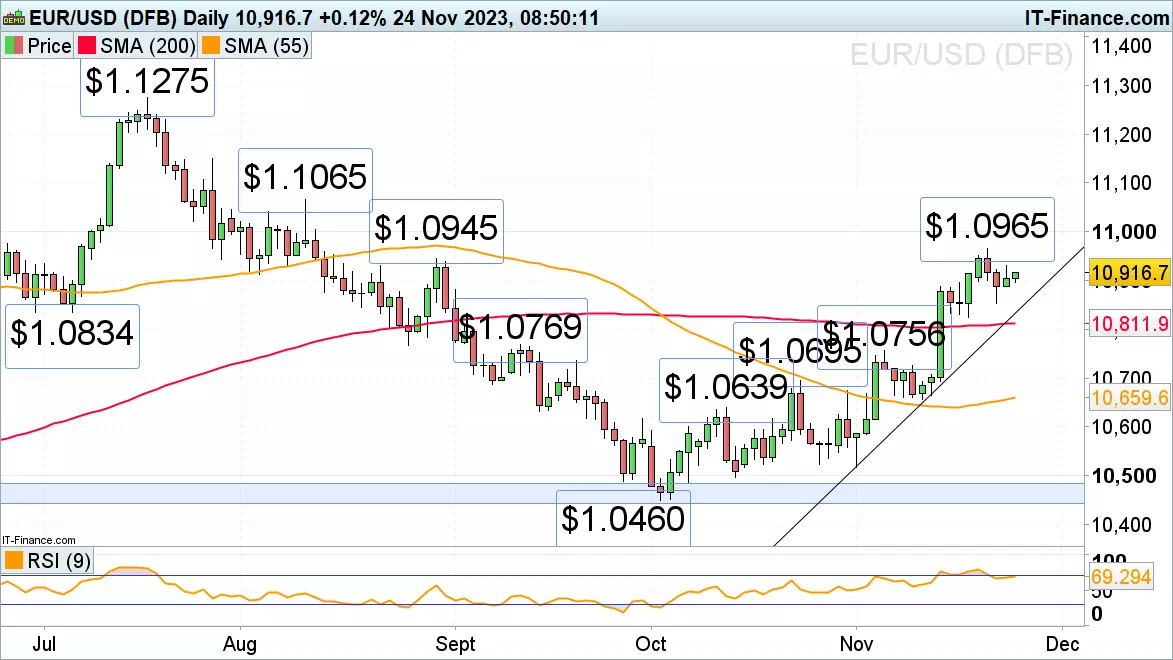
EUR/USD range bound below its four-month high
EUR/USD continues to trade in low volatility and volume as US market participants are mainly absent due to the prolonged Thanksgiving holiday.
The cross still has the $1.0945 late August high in its sights, a rise above which would open the way for its four-month high at $1.0965 to be reached. Further up lie the late June high at $1.1012 and the August peak at $1.1065.
A bullish run will remain the most likely scenario as long as Wednesday’s low at $1.0853 underpins. Minor support below that low comes in around the $1.0834 July low and the 200-day simple moving average (SMA) at $1.0812.
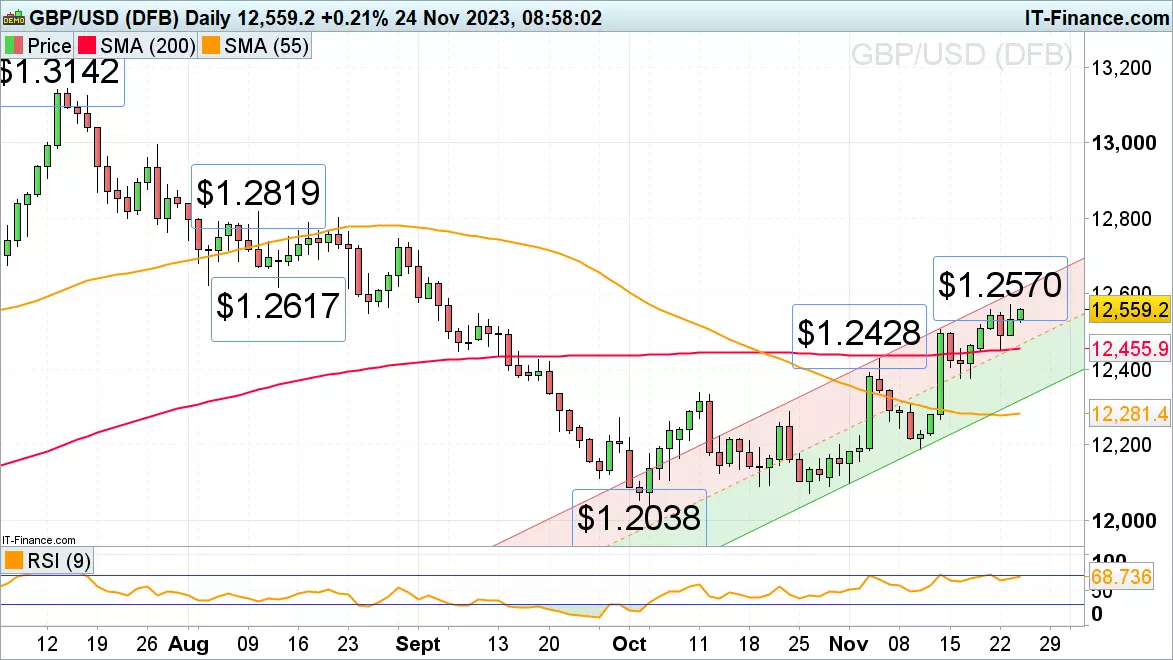
GBP/USD rises on improving UK consumer confidence
GBP/USD is closing in on this week’s high at $1.257 as GfK consumer confidence for November comes in better-than-expected at -24 versus -30 in October. A rise above $1.257 will likely target the mid-August low at $1.2617.
The current upside momentum should prevail while Wednesday’s low and the 200-day SMA at $1.2455 to $1.245 underpin. Only a currently unexpected drop through this support zone would engage the early November high at $1.2428.
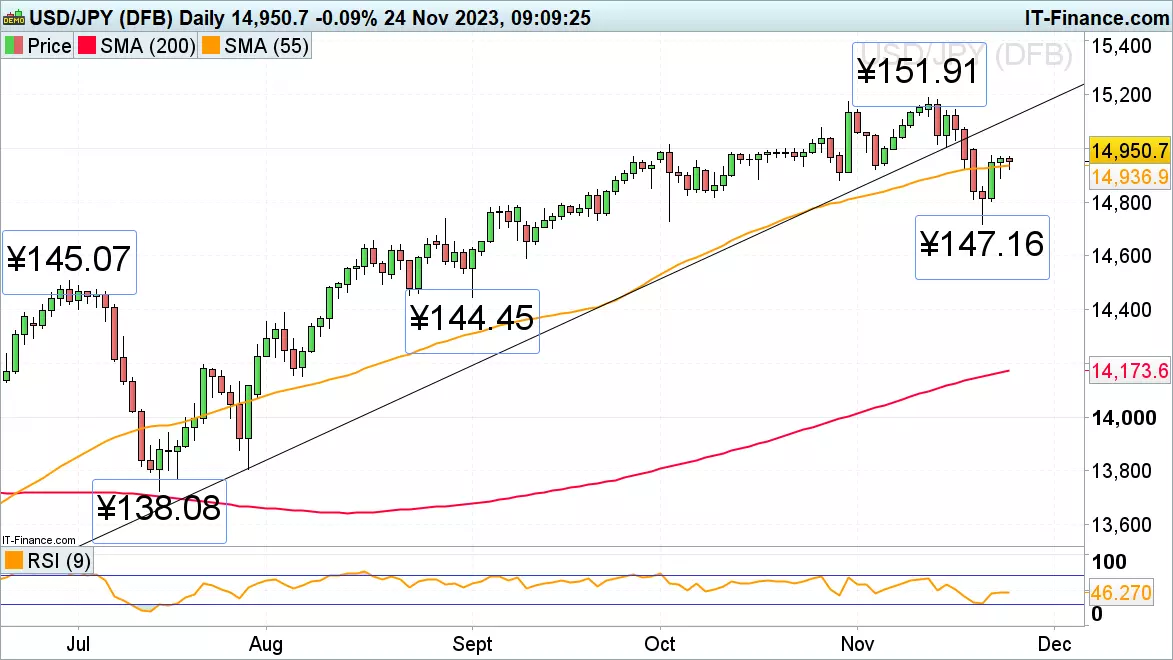
USD/JPY recovery is ongoing
USD/JPY’s swift descent from marginally below its October 2022 peak at ¥151.95 to this week’s ¥147.16 low has been followed by a bounce back to Wednesday’s ¥149.75 high which remains in sight.
With Japan’s October month-on-month (MoM) inflation seeing its highest jump in a decade by 0.7% and year-on-year (YoY) inflation rising to 3.3% while US yields are bouncing back, USD/JPY is likely to head back up again.
A rise above ¥149.75 would eye the early October peak at ¥150.16. Further potential minor resistance can be spotted at the 26 October high at ¥150.78. Minor support below the 55-day SMA at ¥149.37 can be found at the late October low at ¥148.81.
This information has been prepared by IG, a trading name of IG Markets Limited. In addition to the disclaimer below, the material on this page does not contain a record of our trading prices, or an offer of, or solicitation for, a transaction in any financial instrument. IG accepts no responsibility for any use that may be made of these comments and for any consequences that result. No representation or warranty is given as to the accuracy or completeness of this information. Consequently any person acting on it does so entirely at their own risk. Any research provided does not have regard to the specific investment objectives, financial situation and needs of any specific person who may receive it. It has not been prepared in accordance with legal requirements designed to promote the independence of investment research and as such is considered to be a marketing communication. Although we are not specifically constrained from dealing ahead of our recommendations we do not seek to take advantage of them before they are provided to our clients. See full non-independent research disclaimer and quarterly summary.

Start trading forex today
Find opportunity on the world’s most-traded – and most-volatile – financial market.
- Trade spreads from just 0.6 points on EUR/USD
- Analyse with clear, fast charts
- Speculate wherever you are with our intuitive mobile apps
See an FX opportunity?
Try a risk-free trade in your demo account, and see whether you’re onto something.
- Log in to your demo
- Take your position
- See whether your hunch pays off
See an FX opportunity?
Don’t miss your chance – upgrade to a live account to take advantage.
- Get spreads from just 0.6 points on popular pairs
- Analyse and deal seamlessly on fast, intuitive charts
- See and react to breaking news in-platform
See an FX opportunity?
Don’t miss your chance. Log in to take your position.
Live prices on most popular markets
- Equities
- Indices
- Forex
- Commodities
Prices above are subject to our website terms and agreements. Prices are indicative only. All share prices are delayed by at least 15 minutes.
Prices above are subject to our website terms and agreements. Prices are indicative only. All shares prices are delayed by at least 15 mins.