EUR/USD holds firm as GBP/USD drops back, while USD/JPY rebounds
The euro is holding up against the dollar, while sterling is coming under pressure. USD/JPY has staged a rebound from ¥147.


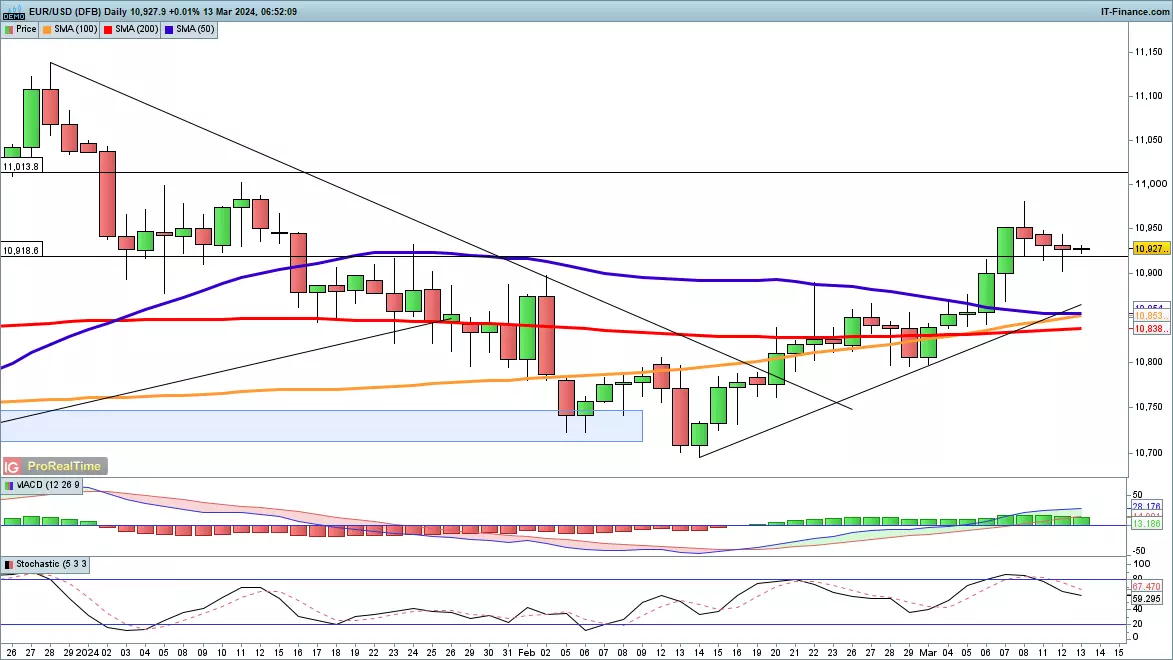
EUR/USD decline slows
The EUR/USD pair has steadily moved lower over the past three sessions, though each day has seen buying at the lows.
In the short term, further declines could head towards rising trendline support from the February low. A fresh push above $1.095 would mark a potential break to the upside, and on to $1.10.
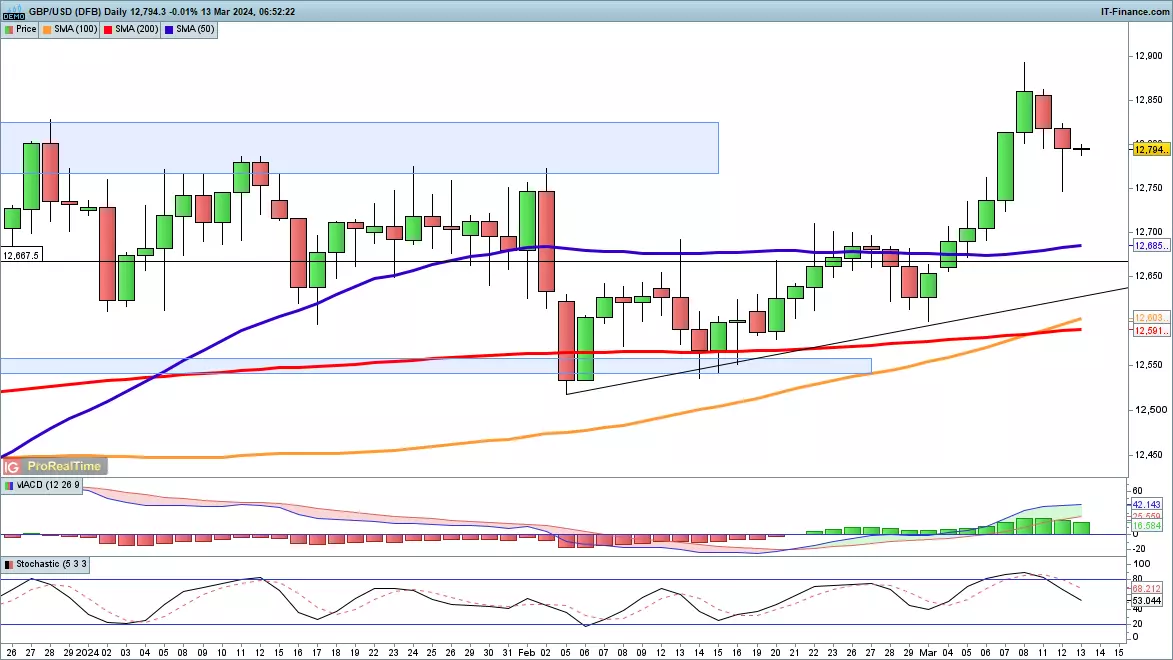
GBP/USD drops back from recent high
The GBP/USD pair weakened after the US consumer price index (CPI) print on Tuesday, though buyers emerged to defend the lows during the session.
A move back above $1.285 would suggest further upside is possible, targeting the highs of $1.30 last seen at the end of July last year. In the short-term, rising trendline support from the January low continues to act to prevent further downside.
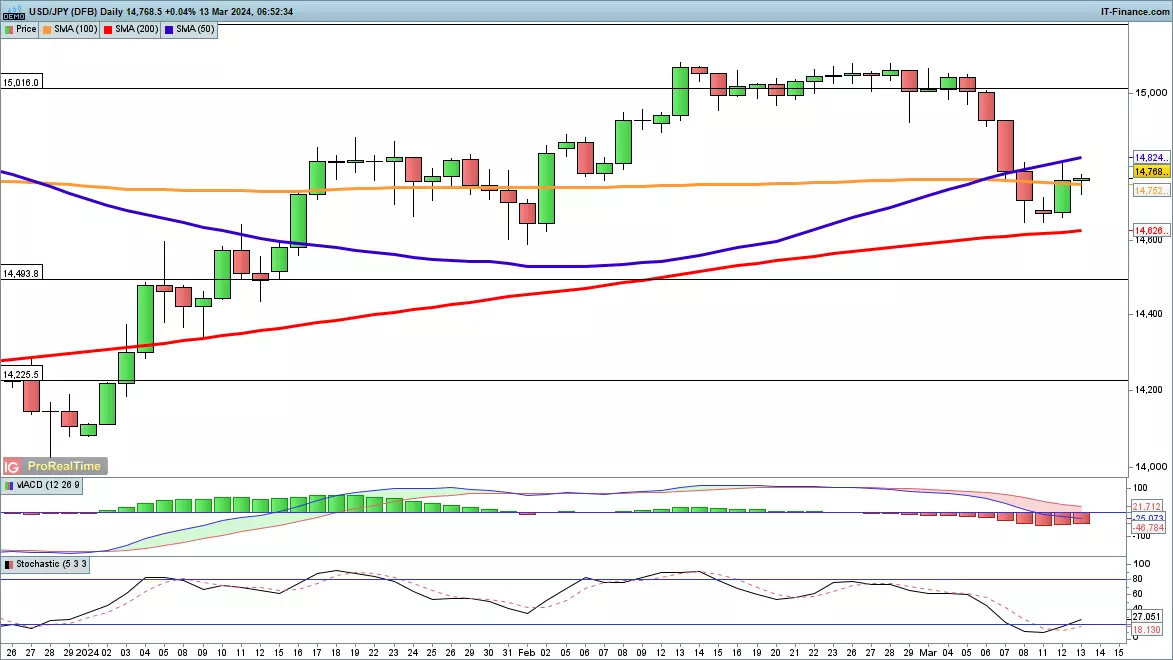
USD/JPY pullback halts at ¥147
Tuesday saw the USD/JPY price recover above ¥147, with the recent pullback stalled for now above the 200-day single moving average (SMA).
A fresh move higher back above the 50-day SMA would then clear the way for gains towards the ¥151 level. A close below ¥146 negates this view.
This information has been prepared by IG, a trading name of IG Markets Limited. In addition to the disclaimer below, the material on this page does not contain a record of our trading prices, or an offer of, or solicitation for, a transaction in any financial instrument. IG accepts no responsibility for any use that may be made of these comments and for any consequences that result. No representation or warranty is given as to the accuracy or completeness of this information. Consequently any person acting on it does so entirely at their own risk. Any research provided does not have regard to the specific investment objectives, financial situation and needs of any specific person who may receive it. It has not been prepared in accordance with legal requirements designed to promote the independence of investment research and as such is considered to be a marketing communication. Although we are not specifically constrained from dealing ahead of our recommendations we do not seek to take advantage of them before they are provided to our clients. See full non-independent research disclaimer and quarterly summary.

Start trading forex today
Find opportunity on the world’s most-traded – and most-volatile – financial market.
- Trade spreads from just 0.6 points on EUR/USD
- Analyse with clear, fast charts
- Speculate wherever you are with our intuitive mobile apps
See an FX opportunity?
Try a risk-free trade in your demo account, and see whether you’re onto something.
- Log in to your demo
- Take your position
- See whether your hunch pays off
See an FX opportunity?
Don’t miss your chance – upgrade to a live account to take advantage.
- Get spreads from just 0.6 points on popular pairs
- Analyse and deal seamlessly on fast, intuitive charts
- See and react to breaking news in-platform
See an FX opportunity?
Don’t miss your chance. Log in to take your position.
Live prices on most popular markets
- Equities
- Indices
- Forex
- Commodities
Prices above are subject to our website terms and agreements. Prices are indicative only. All share prices are delayed by at least 15 minutes.
Prices above are subject to our website terms and agreements. Prices are indicative only. All shares prices are delayed by at least 15 mins.