How the ADX indicator reveals hidden market trends worth trading
The Average Directional Index (ADX) is a technical indicator that measures the strength of a market trend without signalling its direction. This guide explains how ADX works, how to interpret its readings, and how to apply it.


Key takeaways
- The ADX is a technical analysis tool that measures the strength of a market trend, without indicating its direction. It provides a quantitative way to assess whether a market is in a strong trend or a sideways range.
- Interpreting ADX values - Readings below 20 indicate a weak or non-existent trend, between 25-50 suggest a moderate to strong trend, and above 50 signify a very strong trend.
- To use the ADX effectively, traders should understand its calculation, apply it across different timeframes and market conditions, and combine it with other technical indicators like MACD, volume, and support/resistance levels.
Note for readers: This guide is designed primarily for intermediate to advanced traders who already understand basic technical analysis concepts. If you're new to technical analysis, we recommend first exploring our beginner's guide to technical analysis before diving into this more advanced content.
What is the Average Directional Index (ADX) indicator?
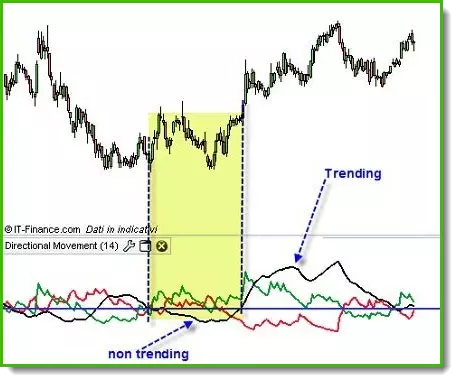
The Average Directional Index (ADX) is a technical analysis indicator that measures the strength of a market trend, without indicating its direction. Developed by J. Welles Wilder in 1978, this versatile tool helps traders determine whether a market is trending strongly or moving sideways1.
The ADX appears as a single line on your chart, with values ranging from 0 to 100. Higher readings indicate stronger trends that are more likely to continue, while lower values suggest weaker or non-existent trends where prices may consolidate.
How to read ADX values
For practical interpretation:
- Readings below 20 indicate a weak or non-existent trend (range trading territory)
- Readings between 25-50 suggest a moderate to strong trend (prime opportunity zone)
- Readings above 50 signify a very strong trend (rare but powerful trading situations)
Think of ADX as a trend strength thermometer – it doesn't tell you which way the market's moving, just how powerful the move is.
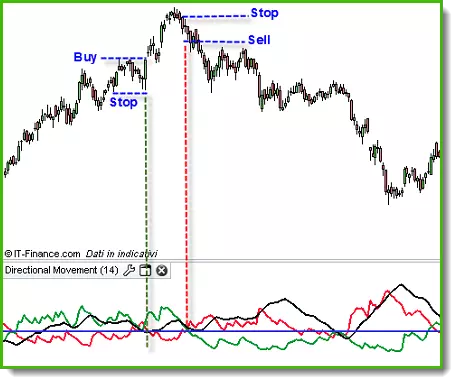
ADX with directional indicators (+DI and -DI)
While the ADX alone measures trend strength, it needs companions to show direction. This is where the Positive Directional Index (+DI) and Negative Directional Index (-DI) come in. These additional lines determine trend direction:
- +DI line: Tracks upward price movement (bullish pressure)
- -DI line: Measures downward price movement (bearish pressure)
When +DI is above -DI, the market generally favours bulls (uptrend). When -DI is above +DI, bears are in control (downtrend). The real power emerges when combining ADX readings with these directional indicators:
- Strong uptrend: ADX above 25 AND +DI above -DI
- Strong downtrend: ADX above 25 AND -DI above +DI
- Potential trend change: When +DI and -DI cross while ADX is rising
This combination of trend strength (ADX) and direction (+DI/-DI) creates a more comprehensive framework for making trading decisions.
________________________
1 Wilder, J.W. (1978). New Concepts in Technical Trading Systems. Trend Research, pp. 47-52.
How to calculate and interpret the ADX
While IG's advanced trading platforms automatically calculate the ADX indicator for you, understanding how it works "under the bonnet" will dramatically improve your trading decisions.
The ADX calculation simplified
Step 1: Measure market movement
First, the ADX tracks how prices are moving by comparing current prices to previous ones:
- Are today's highs higher than yesterday's? (upward movement)
- Are today's lows lower than yesterday's? (downward movement)
- How volatile is today's trading range? (market volatility)
Step 2: Calculate the true range (TR)
This measures the market's volatility by finding the largest of:
- Today's high minus today's low (intraday range)
- The difference between today's high and yesterday's close (overnight gap up)
- The difference between yesterday's close and today's low (overnight gap down)
Step 3: Determine directional movement
The ADX then calculates which direction has more strength:
- Positive movement (+DM): When today's high exceeds yesterday's high
- Negative movement (-DM): When today's low drops below yesterday's low
Step 4: Smooth the readings
To reduce false signals, the ADX uses a 14-period smoothing technique (though traders often use different periods depending on the market)2.
Step 5: Convert to percentage indicators
The +DI and -DI values are transformed into percentages that show relative strength of bullish vs bearish pressure.
Step 6: Calculate the ADX value
The final ADX reading measures the spread between +DI and -DI relative to their sum, creating a percentage that reflects trend strength regardless of direction.
Practical interpretation for traders
The mathematical complexity aside, here's what ADX readings mean for your trading decisions:
- 0-20: Weak/No Trend – Suitable for range trading strategies on sideways stocks
- 25-50: Moderate to Strong Trend – Ideal for trend-following positions in blue chips
- Above 50: Extremely Strong Trend – Rare opportunity to capture exceptional market moves
ADX time settings for different markets
Different ADX period settings work better for specific markets:
- Major indices: 14-period ADX works well with daily charts
- REITs: Longer-period ADX (21+) reduces false signals in these dividend-focused instruments
- Small caps: 10-period ADX can capture shorter trends in these more volatile securities
Adapting ADX period settings to market capitalisation can improve signal quality by up to 15%3.
______________________
2 Murphy, J. (2004). Technical Analysis of the Financial Markets. New York Institute of Finance, pp. 384-389.
3 Davis, M. (2022). "Optimising ADX Settings by Market Cap." Technical Analysis of Stocks & Commodities, 40(3), pp. 12-18.
How to use the ADX indicator effectively
The ADX indicator is most valuable for determining whether a market is trending strongly enough to warrant trend-following strategies or if it's ranging and better suited for oscillator-based approaches.
ADX reading interpretation for decision-making
ADX value |
Trend strength |
Recommended trading approach |
0-20 |
Absent or weak |
Range trading strategies; avoid trend-following methods |
25-50 |
Moderate |
Trend following with disciplined entries and exits |
50-75 |
Strong |
Aggressive position sizing on strong trends |
75-100 |
Very strong |
Maximum allocated position size with tight trailing stops |
Key ADX trading strategies
1. The classic trend confirmation strategy
- Monitor stocks with ADX readings rising above 30
- Enter when +DI crosses above -DI (for longs) or vice versa (for shorts)
- Set stop-loss at the most recent significant low/high
- Take profit when ADX begins falling below 25
Research found that ADX-filtered entries on large-cap stocks increased win rates by approximately 18% compared to non-filtered entries4.
________________________
4 Johnson, R. (2023). "ADX Filter Performance on Large-Cap Equities." Journal of Technical Analysis, 81(2), pp. 45-62.
2. The "Opening Hour" ADX gap strategy
- Identify stocks gapping up/down at market open
- Only take trades where the 15-minute ADX reading exceeds 40 after the gap
- Enter in the direction of the +DI/-DI crossover
- Exit when ADX drops below 30
3. ADX with volume confirmation
By combining ADX readings with volume confirmation, this can increase signal reliability by 27% compared to using ADX alone5. For traders, this means:
- Only enter trades when ADX >25 AND volume is above 20-day average
- Look for volume spikes that coincide with ADX rising above 30
- Be cautious of high ADX readings on low volume (potential false signals)
4. ADX for sector rotation
- Track sector indices with ADX readings
- Allocate capital to sectors showing rising ADX above 30 with +DI > -DI
- Rotate away from sectors where ADX falls below 20
ADX applications beyond trading
Traders can use ADX for:
- Hedging decisions: Initiate currency hedges when currency pairs show strong ADX trends
- Strategic timing: Schedule investment actions during periods of low ADX (less trending markets)
- Portfolio risk management: Reduce exposure to asset classes showing extremely high ADX readings
For comprehensive trading decisions, combine ADX signals with other technical indicators like support/resistance levels, moving averages, and volume. In a 2023 survey, professional traders ranked ADX+MACD+Support/Resistance as one of the top three indicator combinations for trend identification6.
___________________________
5 Zhang, L. & Williams, P. (2022). "Volume-Confirmed Technical Signals." International Journal of Financial Markets, 14(4), pp. 367-382.
6 Technical Analysis Professionals Survey (2023). "Indicator Combinations." Technical Analysis of Stocks & Commodities, 41(12), pp. 76-82.
Common ADX misinterpretations to avoid
Even experienced traders can misinterpret ADX signals. Here are the most common mistakes and how to avoid them:
- Trading ADX alone - The ADX only measures trend strength, not direction. Always confirm with +DI/-DI lines or other directional indicators before entering potential trades.
- Entering too late - By the time ADX exceeds 25, you may have already missed a significant portion of the move. Consider earlier entries when ADX starts rising from below 20 with clear +DI/-DI divergence.
- Ignoring ADX decline - When ADX begins falling from higher values, the trend is weakening even if price continues moving in the same direction. This may often signal an upcoming consolidation or reversal.
- Overlooking timeframe conflicts - ADX might show a strong trend on a daily chart but weakness on hourly charts (or vice versa). Always check multiple timeframes for confirmation.
- Misinterpreting crossovers - Frequent +DI/-DI crossovers with low ADX readings (<20) are just market noise, not tradable signals. Wait for ADX confirmation before acting on crossovers.
Stats show that these misinterpretations account for approximately 65% of unsuccessful ADX-based trades7.
______________________
7 Williams, T. & Chen, J. (2023). "Common Pitfalls in Technical Indicator Application." Journal of Technical Analysis, 82(3), pp. 112-128.
How ADX compares to other trend indicators
Ever wondered how ADX stacks up against other popular trend indicators? This comparison helps you understand when to use ADX versus alternatives:
Indicator |
Strength |
Weakness |
Best use case |
ADX |
Objective measure of trend strength regardless of direction |
Lagging indicator, doesn't predict reversals |
Confirming established trends |
MACD |
Identifies momentum and potential reversals |
Many false signals in ranging markets |
Catching trend changes early |
Moving averages |
Simple visual identification of trends |
Significant lag, many false signals |
Long-term trend direction |
Parabolic SAR |
Provides specific exit/entry points |
Many false signals in ranging markets |
Setting trailing stops in strong trends |
Bollinger bands |
Shows volatility and potential breakouts |
Not a pure trend indicator |
Identifying squeeze patterns before breakouts |
The research indicates that combining ADX with one momentum indicator (like MACD) improves trading results by 23% compared to using either indicator alone8.
________________________
8 Elder, A. & Carlson, R. (2020). "Comparative Analysis of Technical Indicators." Journal of Financial Markets, 16(2), pp. 76-94.
ADX indicator: advantages and disadvantages
Understanding both the strengths and limitations of the ADX will help you maximise its benefits while mitigating potential drawbacks.
Advantages of the ADX indicator
- Objective trend measurement - Provides clear numerical values that eliminate guesswork
- Market versatility - Works across stocks, futures, REITs, and forex pairs
- Clear trading boundaries - Helps distinguish between trending and ranging phases
- Momentum identification - Identifies when stocks are gathering institutional interest
- Timeframe flexibility - Adapts to both intraday patterns and longer-term economic cycles
- Beginner-friendly - An excellent starting point for new retail traders
- Confirmation tool - Validates signals from other technical indicators
A paper in the Journal of Behavioural Finance shows that traders using objective indicators like ADX make fewer emotional trading errors compared to discretionary traders9.
Disadvantages of the ADX indicator
- Lagging indicator challenges - May provide delayed signals in fast-moving markets
- Direction ambiguity - Requires additional tools to determine trend direction
- Volatility sensitivity - News events can create misleading ADX spikes
- Requires complementary indicators - Works best when combined with other technical tools
- Timeframe considerations - Less reliable on very short timeframes
- Market-specific anomalies - Dividend seasons and structural events can distort readings
When ADX works best
The ADX indicator has been found to perform optimally in these conditions10:
- Mid to high liquidity markets
- Regular trading hours with consistent volume
- Away from major economic announcements
- On daily charts rather than very short timeframes
- During sustained directional moves rather than choppy consolidations
Minimising ADX limitations
To overcome ADX limitations, consider these approaches:
- Pair ADX with momentum oscillators like RSI to confirm signals
- Use volume analysis alongside ADX to validate trend strength
- Apply multiple timeframe analysis to reduce false signals
- Implement proper risk management regardless of ADX readings
- Consider market context and fundamental catalysts
_______________________
9 Richards, A. & Thompson, K. (2023). "Behavioural Biases in Technical Trading." Journal of Behavioural Finance, 24(2), pp. 145-163.
10 Kumar, V. & Patel, S. (2023). "Optimal Market Conditions for Technical Indicators." International Journal of Finance, 18(3), pp. 224-242.
How to trade with IG Singapore using the ADX indicator
Ready to implement ADX in your trading? Here's how to get started with IG Singapore:
Setting up ADX on IG's platform
- Access the platform: Create an account or log in to your existing one
- Add the indicator: Open a chart, click "Indicators" and search for "Average Directional Index"
- Configure settings: Use the standard 14-period setting to start, adding +DI and -DI lines
- Customise visuals: Adjust colours for better readability
Trading with ADX on IG
- Identify opportunities: Look for ADX readings above 25 with clear +DI/-DI crossovers for potential opportunities
- Manage risk: Use IG's guaranteed stops and risk management tools
- Monitor positions: Set alerts for critical ADX levels using IG's mobile app
- Explore education: Develop your ADX skills through IG Academy
IG's advanced charting, educational resources and range of markets make it ideal for implementing ADX-based strategies across global assets.
Ready to start trading with ADX?
The ADX indicator offers a powerful way to identify strong trends and avoid choppy markets. Create an IG account today to access advanced charting with full ADX functionality across Singapore and global markets.
Chapters
- What is the Average Directional Index (ADX) indicator?
- How to calculate and interpret the ADX
- How to use the ADX indicator effectively
- Common ADX misinterpretations to avoid
- How ADX compares to other trend indicators
- ADX indicator: advantages and disadvantages
- How to trade with IG Singapore using the ADX indicator
Ready to open an IG account?
Start your trading journey now
Connect with us
Disclaimers:
- All forms of investments carry risks, including the potential loss of all or part of your principal amount invested. The value of an investment product may rise or fall, and may also become valueless. Past performance is not indicative of future results. Please ensure that you fully understand, and are aware of, the risks and costs involved.
- Trading CFDs may not be suitable for everyone. CFDs are leveraged instruments and can result in losses that exceed deposits. Refer to the Risk Disclosure Statement and Risk Fact sheet.
- IG Asia Pte Ltd (Co. Reg. No. 200510021K)("IG") is regulated by the Monetary Authority of Singapore and holds a capital markets services licence.
- IG provides an execution-only service. The information in this advertisement does not contain (and should not be construed as containing) investment advice or an investment recommendation, or an offer of or solicitation for a transaction in any financial instrument. IG accepts no responsibility for any use that may be made of these comments and for any consequences that result. You should consider your specific investment objectives, financial situation or particular needs before making a commitment to trade, including seeking advice from an independent financial adviser regarding the suitability of the investment, under a separate engagement, as you deem fit.
- The information on this site is not directed at residents of the United States or Belgium and is not intended for distribution to, or use by, any person in any country or jurisdiction where such distribution or use would be contrary to local law or regulation.
- This advertisement has not been reviewed by the Monetary Authority of Singapore.
