Trading charts
Spot price patterns and identify entry points with live forex charts, equity charts and 33 professional indicators.

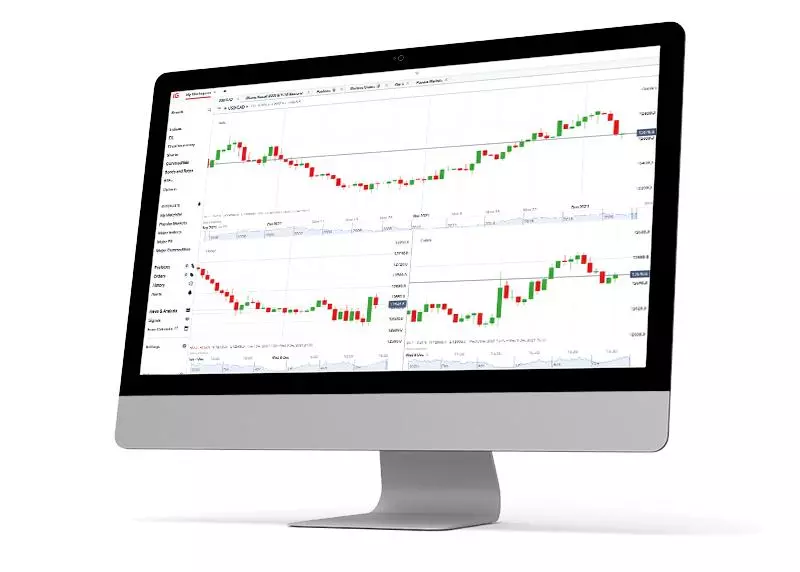
What are live trading charts?
Live trading charts are visual tools that display price movements over time. They help traders identify patterns and make more informed decisions about when to enter or exit the market. Each type of chart presents price data differently, giving you various perspectives on market movements and helping you spot potential trading opportunities.
Why use IG’s live trading charts
Live trading charts
Trade in real-time directly from charts with our user-friendly interface.
Enhanced analysis
Access 33 indicators and 19 drawing tools for in-depth technical analysis.
Lightning-fast
React quickly to market movements with our responsive charting technology.
Multi-timeframe view for complete market insight- feature block
Compare markets side by side with multiple timeframes from 1 minute to 1 month. Spot connections and trends that others miss.
Key features of our live trading charts
- Indicators
- Drawing tools
- Live trading charts
- Trade direct from your chart
33 customisable indicators
Including moving averages, MACD and RSI with customisable settings.

19 precision drawing tools
For trend lines, triangles and rectangles that you can place directly on the chart

Lightning-fast live trading charts
Enjoy effortless trading with HTML5 technology - split charts, add indicators and create annotations at speed.

Click-to-trade functionality built in
React faster to market opportunities by trading directly from your charts - open, edit and close positions with just a couple of clicks or use one-click trading for instant execution.

What are the types of trading charts and how do you read them?
- Candlestick chart
- Line chart
- Bar charts
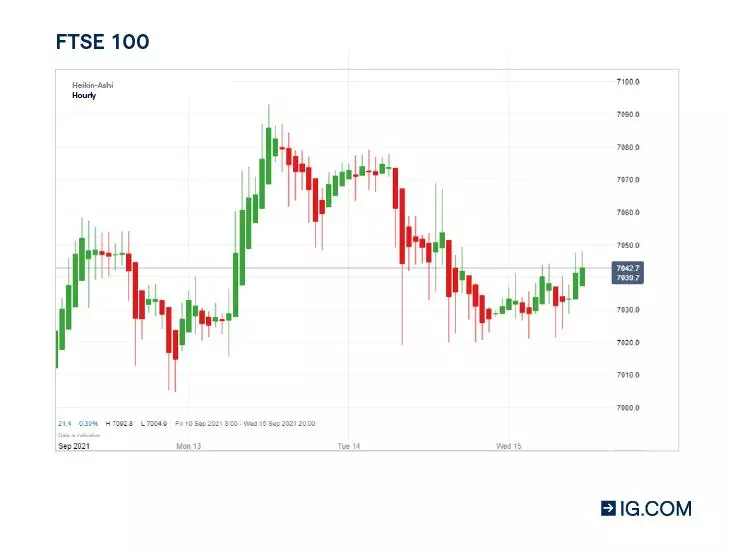
- Heikin-Ashi
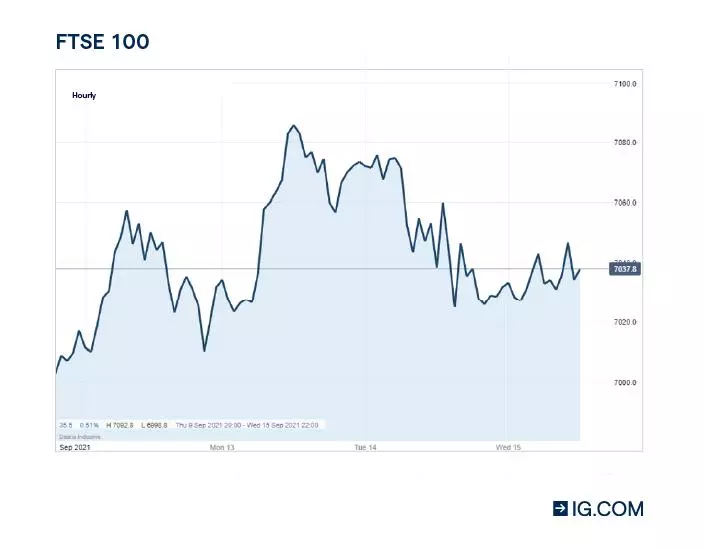
- Mountain chart
What they are
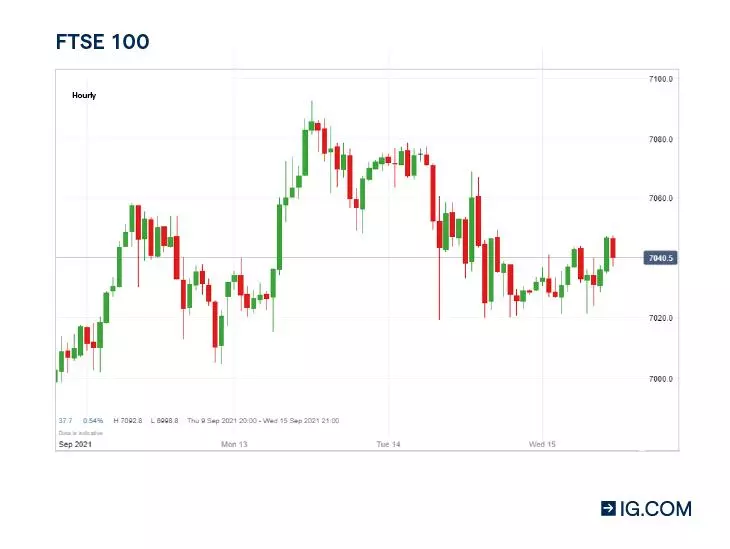
The most popular chart type that shows price movement as candle-shaped bars.
How to read them
- Green candles = price went up (closed higher than it opened)
- Red candles = price went down (closed lower than it opened)
- Thin lines ("wicks") = highest and lowest points reached
- Thick middle section ("body") = range between opening and closing prices
Why traders use them
Best for seeing short-term price movements and spotting potential reversal patterns. Shows the relationship between opening and closing prices in detail.
What they are
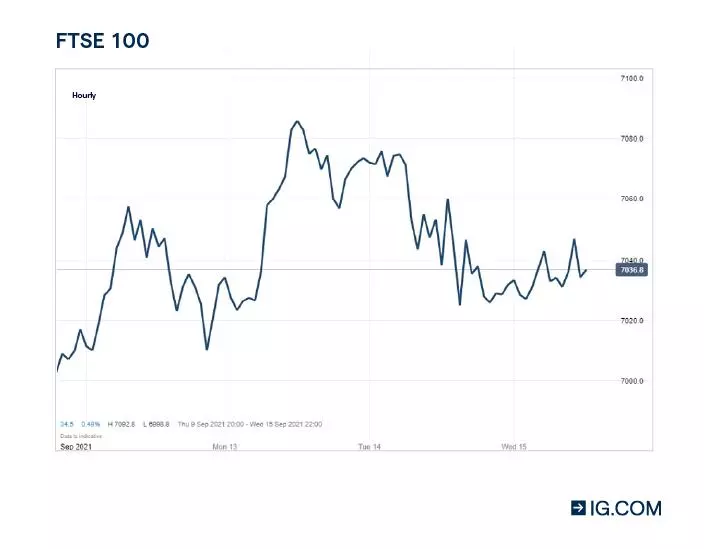
A simple and popular chart type showing only closing prices connected by a line.
How to read them
- Each point on the line = the closing price for that period
- Rising line = prices are trending upward
- Falling line = prices are trending downward
Why traders use them
Perfect for beginners and for seeing the big picture trend without getting distracted by short-term price fluctuations.
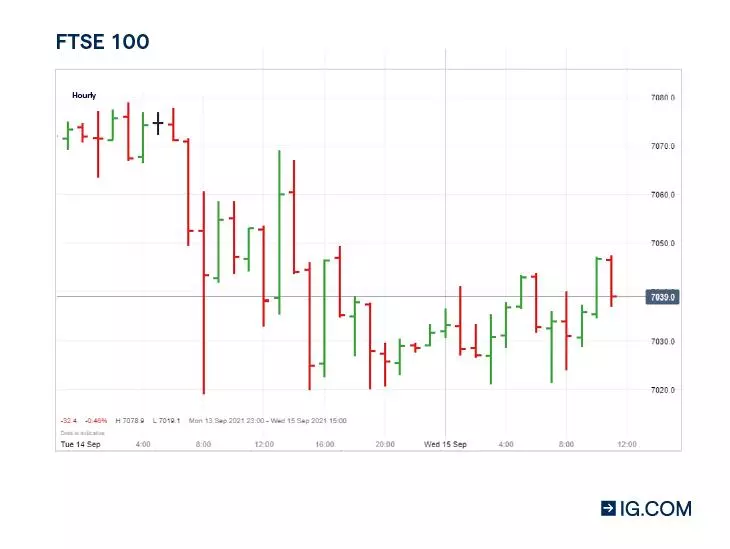
Traditional vertical bars showing the price range with marks for opening and closing prices (also called HLOC charts - High, Low, Open, Close).
How to read them
- Vertical line = entire price range (high to low)
- Left mark = opening price
- Right mark = closing price
- Green bar = price went up during the period
- Red bar = price went down during the period
Why traders use them
Great for technical analysis when you want a cleaner look than candlesticks but still need to see all price information.
What they are
A specialised Japanese charting method that smooths price data to filter out market "noise" (looks like candlesticks but uses averaged price calculations).
How to read them
- Green bars = upward trend
- Red bars = downward trend
- No upper or lower wicks = strong trend in that direction
- Small bodies with long wicks = potential trend reversal
Why traders use them
Excellent for identifying trends and reducing false signals that might appear in regular candlestick charts.
What they are
A variation of line charts with the area beneath the line filled in, creating a "mountain" shape.
How to read them
- The line works exactly like a regular line chart
- Shaded area makes the shape of market movements more visible
- Steep mountain sides = rapid price changes
- Gentle slopes = more stable price movement
Why traders use them
Helpful for visualising the overall shape of the market and identifying significant price movements.
Access live trading charts on these platforms
- IG Online platform
- IG Mobile app
- TradingView
- MetaTrader 4
- ProRealTime


Analyse markets with advanced charting, custom tools, and professional insights.
FAQs
What charts are best for trading?
The best live trading charts are those that offer you the information you need to form an interpretation of the market.
For beginners, line and mountain charts are uncluttered and show price movements clearly. For more experienced traders, candlestick and HLOC charts are useful to gauge price volatility and the pace of change across the shorter-term. Heikin-Ashi charts are suited to experienced traders looking for general price movements and trends over longer periods of time.
Where can I get free live trading charts?
You can get free trading charts in our platform. You can sign up for a free demo account and receive S$200,000 in virtual funds to practise with. You can also create a live trading account. There’s no requirement to fund a live account, so you don’t have to trade until you want to.
What indicators can I use for technical analysis on live trading charts?
With us, you can choose from 33 popular indicators to use for your technical analysis. We also offer 19 drawing tools for you to help visualise important patterns and trends.
Our range of free technical indicators includes (but is not limited to):
- Bollinger Bands
- Exponential moving average
- Ichimoku
- MACDMoving average
- Moving average pivot point
- SuperTrend
- Standard deviation
- Stochastic oscillator
- RSI
- Volume
Try these next
Connect with us
Disclaimers:
- All forms of investments carry risks, including the potential loss of all or part of your principal amount invested. The value of an investment product may rise or fall, and may also become valueless. Past performance is not indicative of future results. Please ensure that you fully understand, and are aware of, the risks and costs involved.
- Trading CFDs may not be suitable for everyone. CFDs are leveraged instruments and can result in losses that exceed deposits. Refer to the Risk Disclosure Statement and Risk Fact sheet.
- IG Asia Pte Ltd (Co. Reg. No. 200510021K)("IG") is regulated by the Monetary Authority of Singapore and holds a capital markets services licence.
- IG provides an execution-only service. The information in this advertisement does not contain (and should not be construed as containing) investment advice or an investment recommendation, or an offer of or solicitation for a transaction in any financial instrument. IG accepts no responsibility for any use that may be made of these comments and for any consequences that result. You should consider your specific investment objectives, financial situation or particular needs before making a commitment to trade, including seeking advice from an independent financial adviser regarding the suitability of the investment, under a separate engagement, as you deem fit.
- The information on this site is not directed at residents of the United States or Belgium and is not intended for distribution to, or use by, any person in any country or jurisdiction where such distribution or use would be contrary to local law or regulation.
- This advertisement has not been reviewed by the Monetary Authority of Singapore.
