Markets continue to price out the risks of a US debt default: US dollar, Hang Seng Index, USD/JPY
Market participants continue to price out the risks of a US debt default overnight, as major US indices delivered their second straight day of gains.

Market Recap
Market participants continue to price out the risks of a US debt default overnight, as major US indices delivered their second straight day of gains (DJIA +0.34%; S&P 500 +0.94%; Nasdaq +1.51%). Further signs of progress were seen, as House Speaker Kevin McCarthy suggested that the House could vote on a debt ceiling deal as soon as next week. While there are still some risks that negotiations could break down then, recent market optimism seems to be pricing for it to be a done deal.
Growth sectors continued to display leadership over value, with big tech still the favourites as defensive plays amid a challenging economic environment. Semiconductor stocks were given a lift overnight as well (PHLX +3.2%, NVDA +5%), bringing the Nasdaq 100 index to a new 52-week high.
Lurking in the backdrop however, rate expectations for another 25 basis-point hike from the Federal Reserve (Fed) in June has been creeping up lately (33% probability being priced, up from just 10% a week ago). More hawkish comments from Fed officials overnight continue to challenge expectations for a June rate pause and this may be the central focus for markets once the hype around US debt ceiling optimism passes.
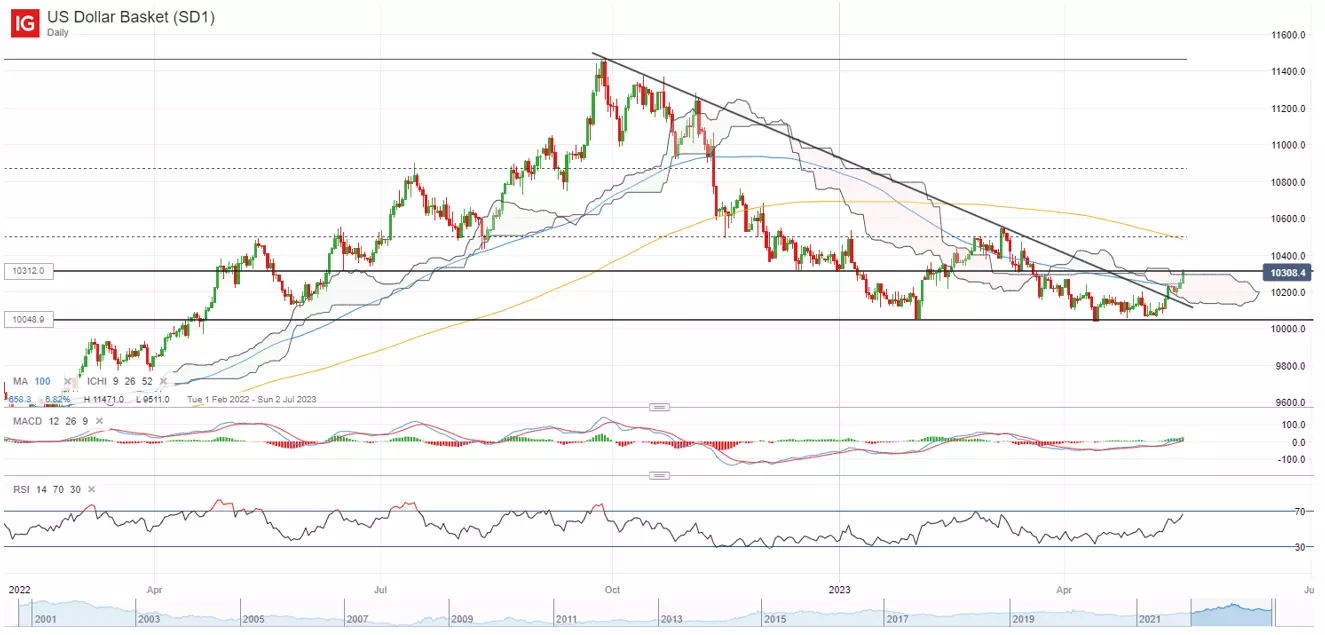
The US dollar has found its way higher to a new one-month high, alongside higher Treasury yields, which reflects the hawkish build in rate expectations. Gold prices declined for the third straight day (-1.2% overnight) after breaching below its key psychological US$2,000 level. The US dollar is currently retesting its 103.12 level, where a previous support-turned-resistance stands alongside the upper edge of its Ichimoku cloud on the daily chart. A successful move beyond this level could leave the 105.00 level on watch next, where its 200-day moving average (MA) awaits.
Asia Open
Asian stocks look set for a positive open, with Nikkei +0.51%, ASX +0.48% and KOSPI +0.77% at the time of writing. While the broader risk environment has been singlehandedly uplifted by progress around the US debt ceiling negotiations, Chinese equities continue to struggle for gains. The Nasdaq Golden Dragon China Index is down 3.5% overnight, tracking a more lacklustre session in Chinese indices the day before.
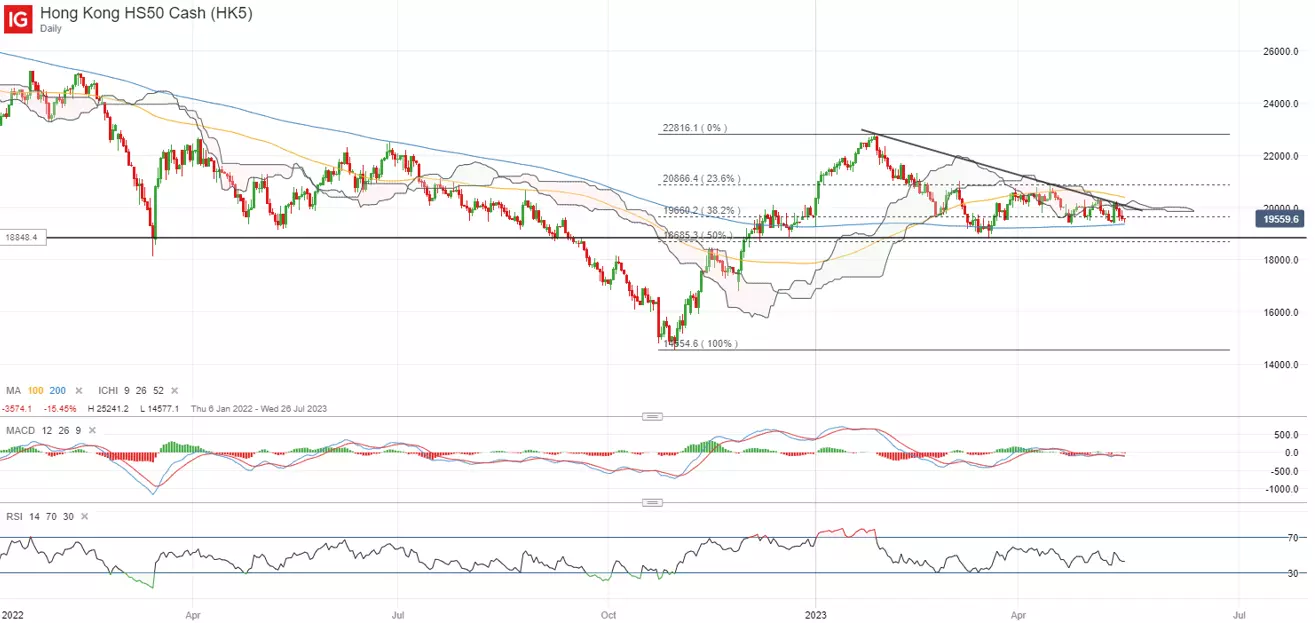
The Hang Seng Index seems to be headed back to retest its key 200-day MA once more, as a series of resistance puts its upside in check. The sharp moderation in China’s economic surprise index since the start of the month suggests that economic conditions have not provided much of a positive catalyst as well, potentially keeping the index on some ranging moves as traction flows to the US on renewed optimism.
On the other hand, the Nikkei 225 index has been stellar, pushing to a new high since 1990. Large investment plans by chipmakers into Japan and some positive surprises out of its growth data have been positive catalysts, but technical conditions in strong overbought territory could leave shorter-term trades as the preferred option to avoid being caught in a sharp retracement. Inflation data out of Japan this morning reflected a sharp pull-ahead in pricing pressures (3.5% versus 2.5% forecast), which may build the case for a quicker shift away from its current accommodative policies.
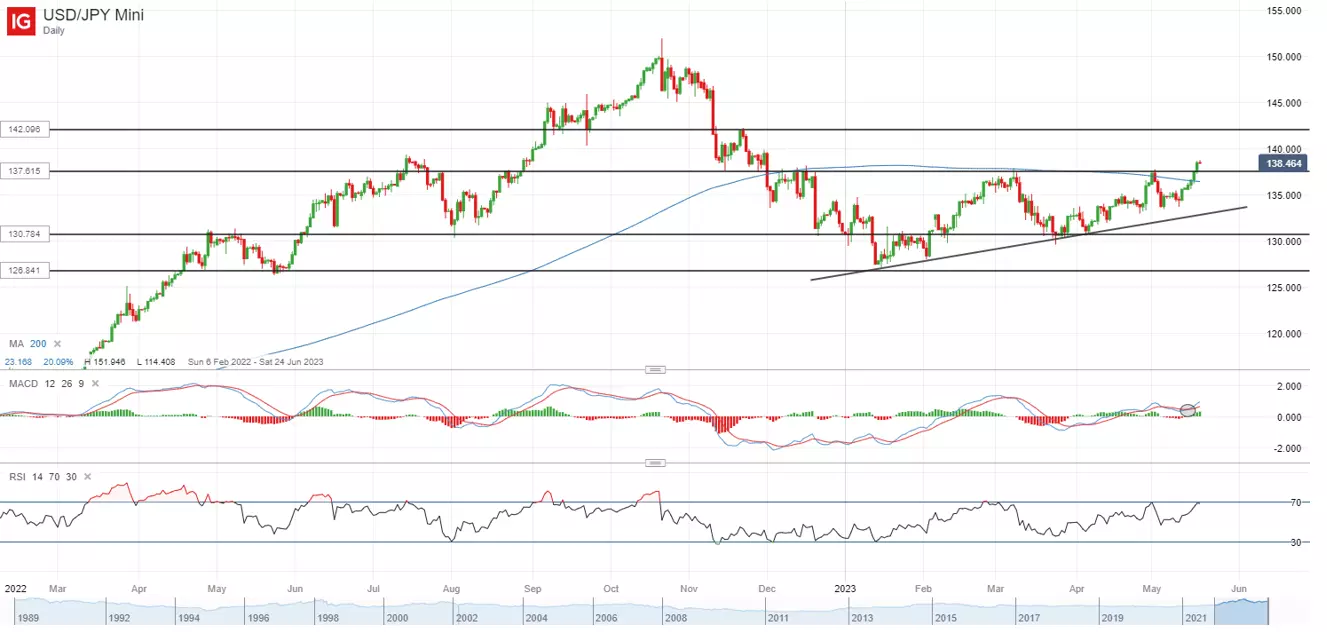
On the watchlist: USD/JPY broke out of ascending triangle pattern + 200-day MA
Renewed strength in the US dollar on the back of US debt ceiling optimism has propelled the USD/JPY to a new year-to-date high, with a move above the 137.60 level signalling a break of an ascending triangle pattern. The pair also reclaimed its 200-day moving average (MA) for the first time since December 2022, with the formation of a new higher high reinforcing the current upward trend in place.
A series of hawkish Fed comments this week has continued to drive increasing bets of another 25 basis-point rate hike from the Fed in June (32% probability being priced), propelling the US dollar to its one-month high. On the other hand, expectations remain firm for the Bank of Japan (BoJ) to stick to its yield curve control policy for the foreseeable future.
Further upmove in the USD/JPY could leave the 142.00 level on watch next, while successfully reclaiming its 200-day MA will leave the line as a crucial support to defend from the bulls.
Thursday: DJIA +0.34%; S&P 500 +0.94%; Nasdaq +1.51%, DAX +1.33%, FTSE +0.25%
IGA, may distribute information/research produced by its respective foreign affiliates within the IG Group of companies pursuant to an arrangement under Regulation 32C of the Financial Advisers Regulations. Where the research is distributed in Singapore to a person who is not an Accredited Investor, Expert Investor or an Institutional Investor, IGA accepts legal responsibility for the contents of the report to such persons only to the extent required by law. Singapore recipients should contact IGA at 6390 5118 for matters arising from, or in connection with the information distributed.
The information/research herein is prepared by IG Asia Pte Ltd (IGA) and its foreign affiliated companies (collectively known as the IG Group) and is intended for general circulation only. It does not take into account the specific investment objectives, financial situation, or particular needs of any particular person. You should take into account your specific investment objectives, financial situation, and particular needs before making a commitment to trade, including seeking advice from an independent financial adviser regarding the suitability of the investment, under a separate engagement, as you deem fit.
No representation or warranty is given as to the accuracy or completeness of this information. Consequently, any person acting on it does so entirely at their own risk. Please see important Research Disclaimer.
Please also note that the information does not contain a record of our trading prices, or an offer of, or solicitation for, a transaction in any financial instrument. Any views and opinions expressed may be changed without an update.

Seize a share opportunity today
Go long or short on thousands of international stocks.
- Increase your market exposure with leverage
- Get spreads from just 0.1% on major global shares
- Trade CFDs straight into order books with direct market access
Live prices on most popular markets
- Forex
- Shares
- Indices
See more forex live prices
See more shares live prices
Prices above are subject to our website terms and agreements. Prices are indicative only. All shares prices are delayed by at least 15 mins.
See more indices live prices
Prices above are subject to our website terms and agreements. Prices are indicative only. All shares prices are delayed by at least 20 mins.
