Wall Street Wrap: US indices ended lower, triple witching looms
The US February producer prices continue to reveal some persistence in inflation pressures, which put Wall Street in the red overnight.


Market Recap
The US February producer prices continue to reveal some persistence in inflation pressures, which put Wall Street in the red overnight (DJIA -0.35%; S&P 500 -0.29%; Nasdaq -0.30%), although the limited downside reaction still seems to be an attempt for some shrugging off in the likes of the consumer prices earlier this week. The US producer price index (PPI) was up 0.6% month-on-month, double the 0.3% expected. Year-on-year, the PPI was up 1.6% versus the previous 1.0%, which may generally suggest greater cost pass-through to consumers ahead.
Perhaps the miss in US February retail sales may help to quell some hawkish views. Retail sales rebounded 0.6% month-on-month but missed the 0.8% consensus, suggesting more lukewarm consumer strength. Weekly jobless claims data came in below-forecasts. The confluence of the data left the Federal Reserve (Fed) funds futures pricing data with a slight hawkish recalibration, but broad consensus remains rooted for the Fed to kickstart its rate-cutting process in June.
The US dollar took it well (+0.6%), taking its cue from a jump in US Treasury yields. The US two-year yields were up 6 basis point (bp), while the 10-year yields gained 10 bp. The Magnificent Seven stocks had a mixed session, with Nvidia down 3.2% and Tesla down 4.1% but some relief came from Microsoft (+2.4%), Alphabet (+2.5%) and Apple (+1.1%).
Look-ahead: Triple witching day, US consumer sentiment index
Ahead, the US University of Michigan (UoM) consumer sentiment index will conclude the week on the economic calendar. A drop in consumer sentiments is typically followed by a recession, so if anything, the recovery trend in the index since July 2022 should provide some basis for soft-landing hopes. Expectations are for the March preliminary reading to come in unchanged at 76.9, with a hover around its two-year high likely to add to the economic resilience story.
In addition, traders will be buckling up for heightened volatility as it is triple witching day – the quarterly expiration of stock options, stock index futures and stock index options contracts all on the same day, where portfolio rebalancing may occur. The last three triple-witching events were met with a slight retracement in the S&P 500 in the days that followed, so one may watch for any signs of weakness if the trend holds.
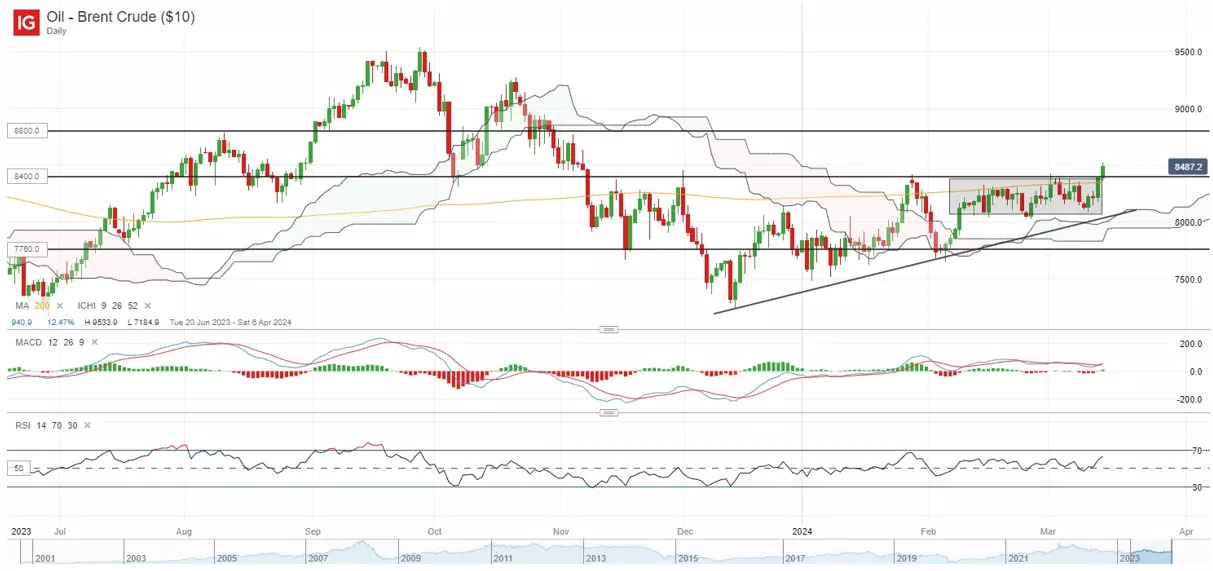
On the watchlist: Brent crude broke out of consolidation range
Following a month-long consolidation phase, oil bulls are rewarded with an upward breakout of prices this week, with prices touching its four-month high. the formation of a new higher high seems to mark a continuation of its upward trend since December last year, riding on a surprise decline in US crude inventories and simmering geopolitical tensions.
With the daily relative strength index (RSI) defending its key 50 level and keeping buyers in control, the next line of resistance to overcome may be at the US$88.00 level. On the downside, the US$84.00 will now serve as a previous resistance-turned-support.
This information has been prepared by IG, a trading name of IG Markets Limited. In addition to the disclaimer below, the material on this page does not contain a record of our trading prices, or an offer of, or solicitation for, a transaction in any financial instrument. IG accepts no responsibility for any use that may be made of these comments and for any consequences that result. No representation or warranty is given as to the accuracy or completeness of this information. Consequently any person acting on it does so entirely at their own risk. Any research provided does not have regard to the specific investment objectives, financial situation and needs of any specific person who may receive it. It has not been prepared in accordance with legal requirements designed to promote the independence of investment research and as such is considered to be a marketing communication. Although we are not specifically constrained from dealing ahead of our recommendations we do not seek to take advantage of them before they are provided to our clients.

Seize a share opportunity today
Go long or short on thousands of international stocks.
- Increase your market exposure with leverage
- Get spreads from just 0.1% on major global shares
- Trade CFDs straight into order books with direct market access
Live prices on most popular markets
- Forex
- Shares
- Indices
