FTSE 100 hits new peak as rate cut hopes boost index
Monday’s session saw the FTSE 100 finally reach a new record high, joining its peers which saw fresh peaks earlier in the year.


FTSE 100 hits new peak as rate cut hopes boost index
Monday’s session saw the FTSE 100 finally reach a new record high, joining its peers which saw fresh peaks earlier in the year.
FTSE 100 closes at record after broad up day for UK stocks
The UK's premier FTSE 100 stock index hit an all-time closing high on Monday, with the blue-chip benchmark surging 1.6% to finish at 8,023.9 points. The rally was broad-based across most index constituents.
Weaker pound helps boost UK exporters
A key factor driving the FTSE 100's record close was the renewed weakness in the British pound versus the U.S. dollar. Sterling slumped 0.3% to $1.2333, its lowest since mid-November. With most FTSE 100 companies earning the majority of their revenues overseas, the weaker pound boosted their relative valuations.
Diverging rate outlook for Fed and Bank of England
Market expectations are building for the Bank of England (BoE) to start cutting interest rates as soon as August. This contrasts with views that the U.S. Federal Reserve (Fed) will keep rates higher for longer. The diverging rate outlook between the BoE and Fed is seen as benefiting the globally-exposed FTSE 100 index.
New highs come despite cheaper valuations
Even after setting a new all-time closing peak, UK stocks continue to trade at a record discount to their peers like the S&P 500. This depressed valuation gap reflects years of underperformance by British equities relative to other major markets. UK companies continue to be snapped up by foreign investors, with engineer Tyman agreeing to a takeover on Monday and other major names in focus.
Energy and bank stocks support FTSE 100 gains
Sector boosts from rising oil prices lifting energy giants like Shell, as well as gains for UK bank stocks amid an emerging economic recovery, have helped drive the FTSE 100's recent rally to new highs.
FTSE 100 technical analysis
The FTSE 100 finally managed to overcome its previous record high dating back to February of last year and is fast approaching the 8,100 mark.
Since over the past decade the index several times fell just short of the psychological 8,000 mark, the question is whether this time round a valid break above that level has finally been made. For now at least, the index seems to be on track for its third consecutive month of gains. This is encouraging for the bulls as it shows consistent buying pressure.
FTSE 100 Monthly Candlestick Chart
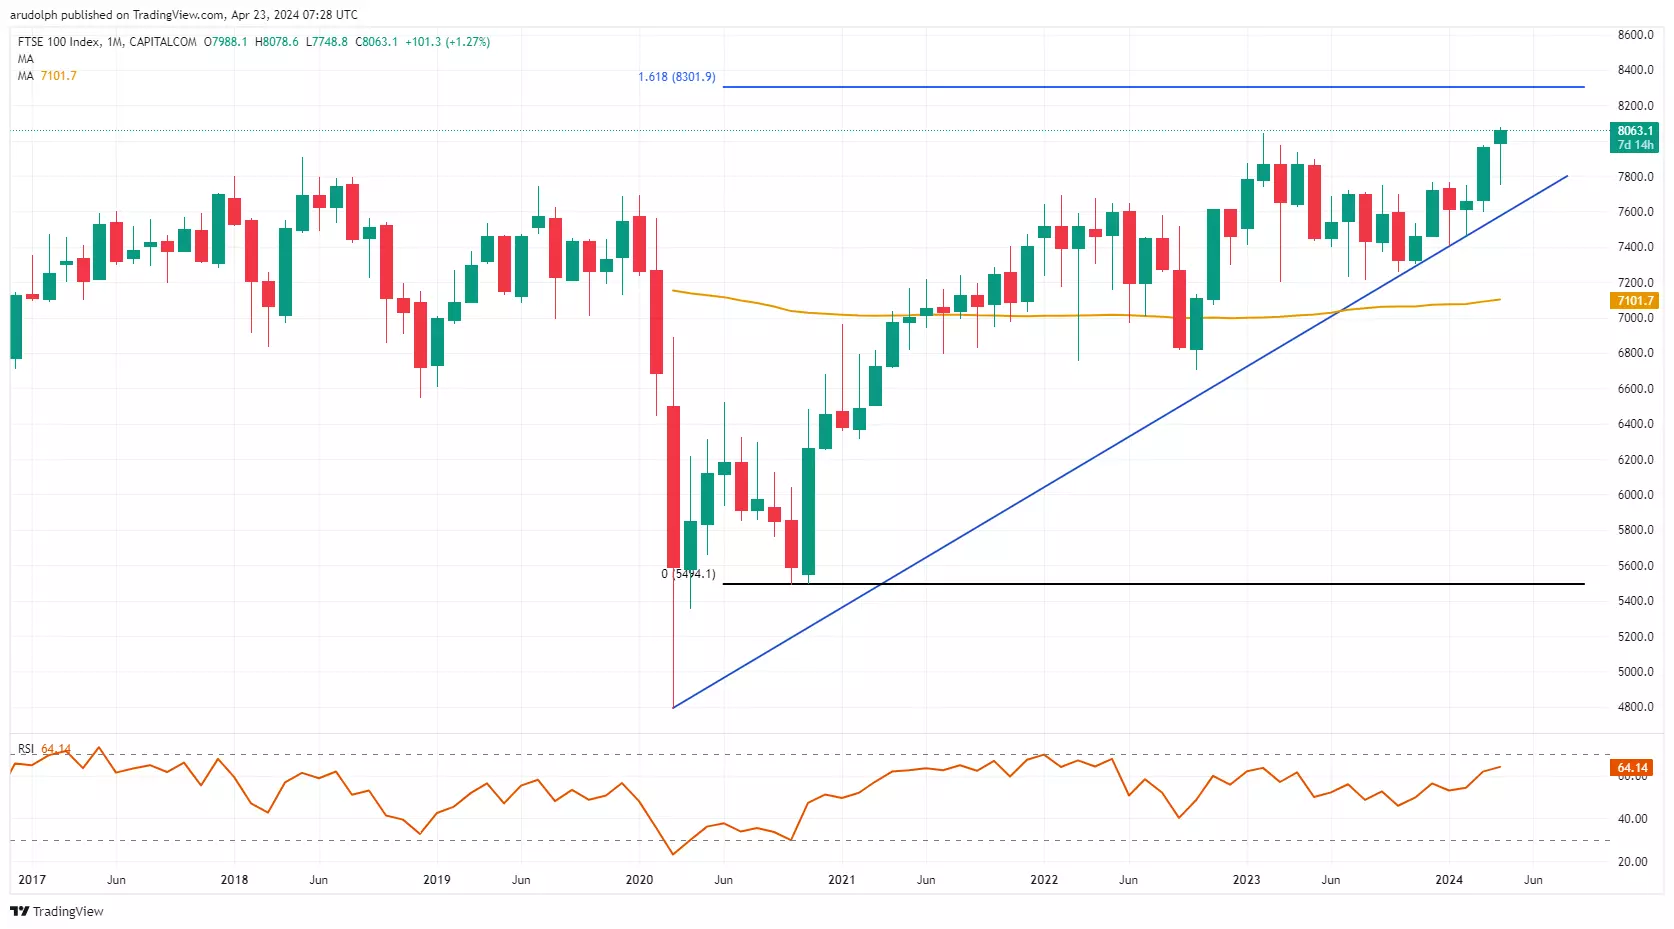
A technical upside target can be found at the 161.8% Fibonacci extension of the March-to-June 2020 advance, projected higher from the October 2020 low, at 8301.90.
This bullish view will remain intact while the 200-day simple moving average (SMA) and the 2020-to-2024 uptrend line at 7,597.9 to 7,582.1 underpin on a weekly chart closing basis.
Immediate upside pressure should be maintained while the FTSE 100 stays above Friday’s one-month low at 7,748.8 on a daily chart closing basis.
FTSE 100 Daily Candlestick Chart
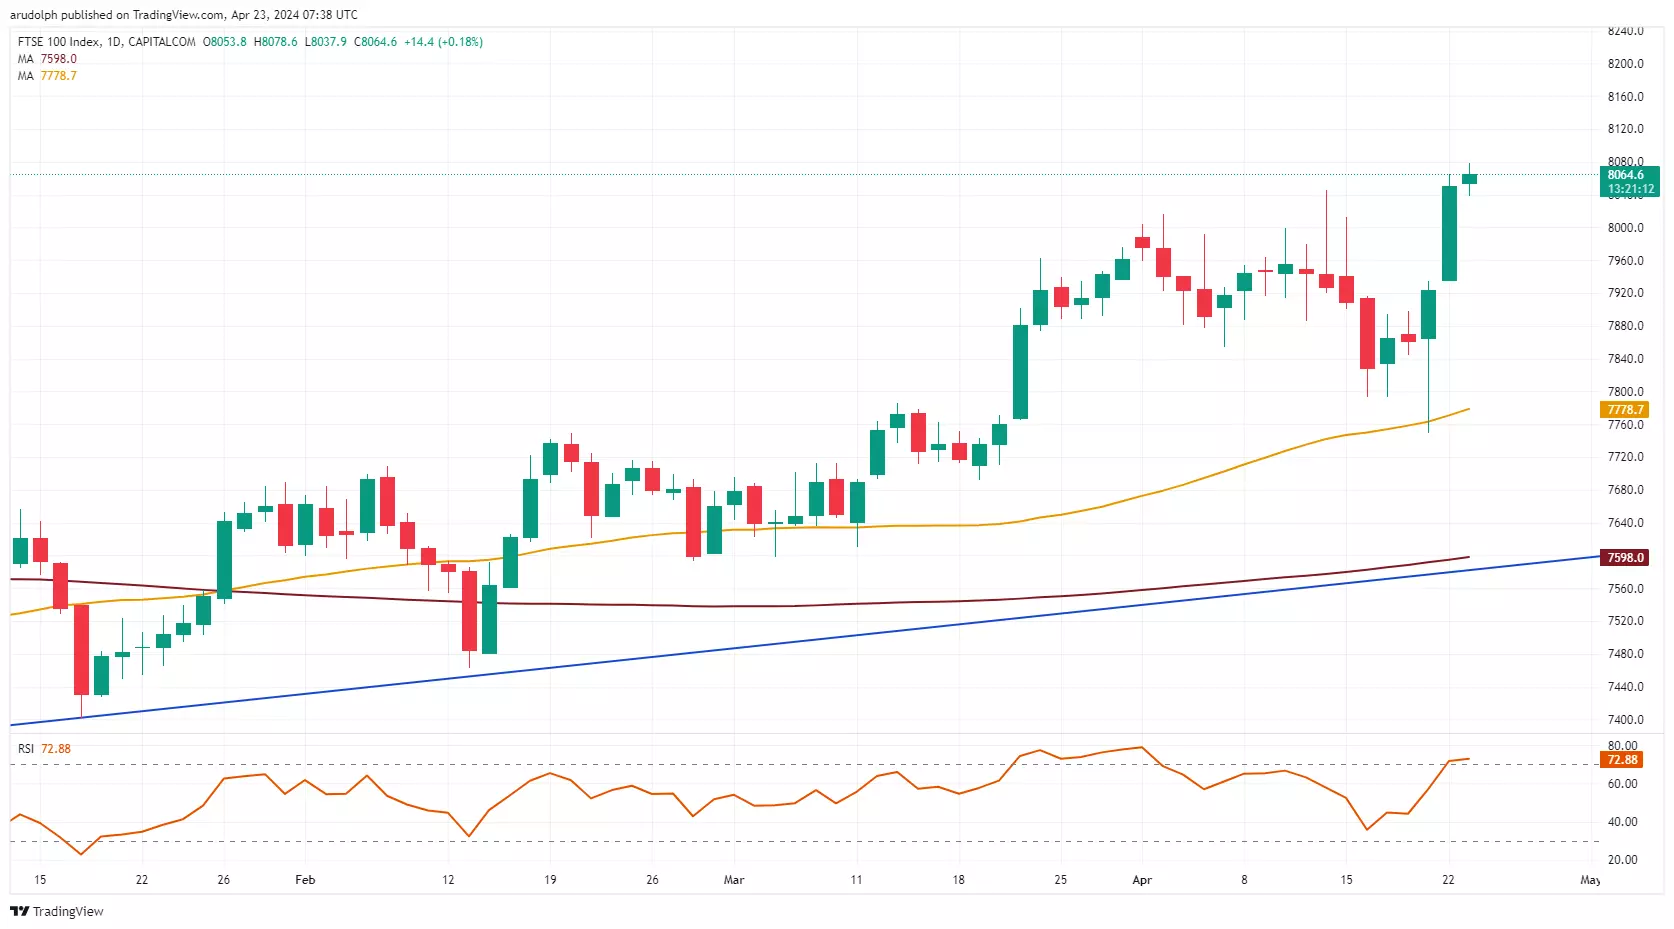
Minor support above these levels can be seen between the 8,016.5 early April high and the psychological 8,000 mark.
This information has been prepared by IG, a trading name of IG Markets Limited. In addition to the disclaimer below, the material on this page does not contain a record of our trading prices, or an offer of, or solicitation for, a transaction in any financial instrument. IG accepts no responsibility for any use that may be made of these comments and for any consequences that result. No representation or warranty is given as to the accuracy or completeness of this information. Consequently any person acting on it does so entirely at their own risk. Any research provided does not have regard to the specific investment objectives, financial situation and needs of any specific person who may receive it. It has not been prepared in accordance with legal requirements designed to promote the independence of investment research and as such is considered to be a marketing communication. Although we are not specifically constrained from dealing ahead of our recommendations we do not seek to take advantage of them before they are provided to our clients.

Take a position on indices
Deal on the world’s major stock indices today.
- Trade the lowest Wall Street spreads on the market
- 1-point spread on the FTSE 100 and Germany 40
- The only provider to offer 24-hour pricing
Live prices on most popular markets
- Forex
- Shares
- Indices
