A trader’s guide to overbought and oversold levels
Identifying overbought and oversold levels is a key part of trading shares, commodities and a range of other markets. So, it’s important to understand what these levels are and how you can identify them.


Overbought vs oversold levels
Overbought and oversold levels describe the price of an asset in relation to its fair value. They help to define market conditions and future trends, providing buy and sell points for a range of asset classes. These levels are most commonly associated with shares, but can be used to trade options, forex and commodities.
For example, when a stock is classified as overbought, it means that there has been consistent upward price movement. This can lead to the asset trading at a higher price than it is currently worth. Once the market reaches a point of maturity or its extreme – once traders think it’s too expensive – a pullback can be expected and the price will decline.
An oversold stock, on the other hand, would be one that is seen as trading below its current value. It is a suggestion that the short-term declines are coming to an end, and a rally could be imminent.
Learn more about overvalued and undervalued stocks.
Overbought and oversold conditions are caused by overreactions to news, earnings releases and other market moving events, tending to carry prices to extremes. So, recognising when these price movements reach maturity is the cornerstone of a good trading strategy.
How to identify overbought and oversold levels
The best way to identify overbought and oversold levels is through technical analysis – using price charts and indicators to highlight patterns in market movements. Technical analysis is based on the assumption that historical trends repeat themselves, so previous levels can help predict future movements.
Overbought and oversold indicators
There are various technical indicators that can be used to identify overbought and oversold levels, but some are more effective than others. The two most popular indicators for charting overbought and oversold conditions are the relative strength index (RSI) and stochastic oscillator.
You can use each separately or in conjunction with each other and other technical indicators.
The relative strength index
The RSI is a momentum indicator, which gauges the speed of price movements. It is used to form assumptions about how sustainable current values are and how likely a change in direction is.
The RSI is calculated using the average of high and low price closes over a given timeframe – usually 14 periods. It is presented as a percentage that moves between zero and 100. As the level gets closer to 100, it means that higher closing levels are more common than lower ones over the chosen timeframe. When the RSI level moves toward zero, it would indicate that lower closing levels are more common than higher ones.
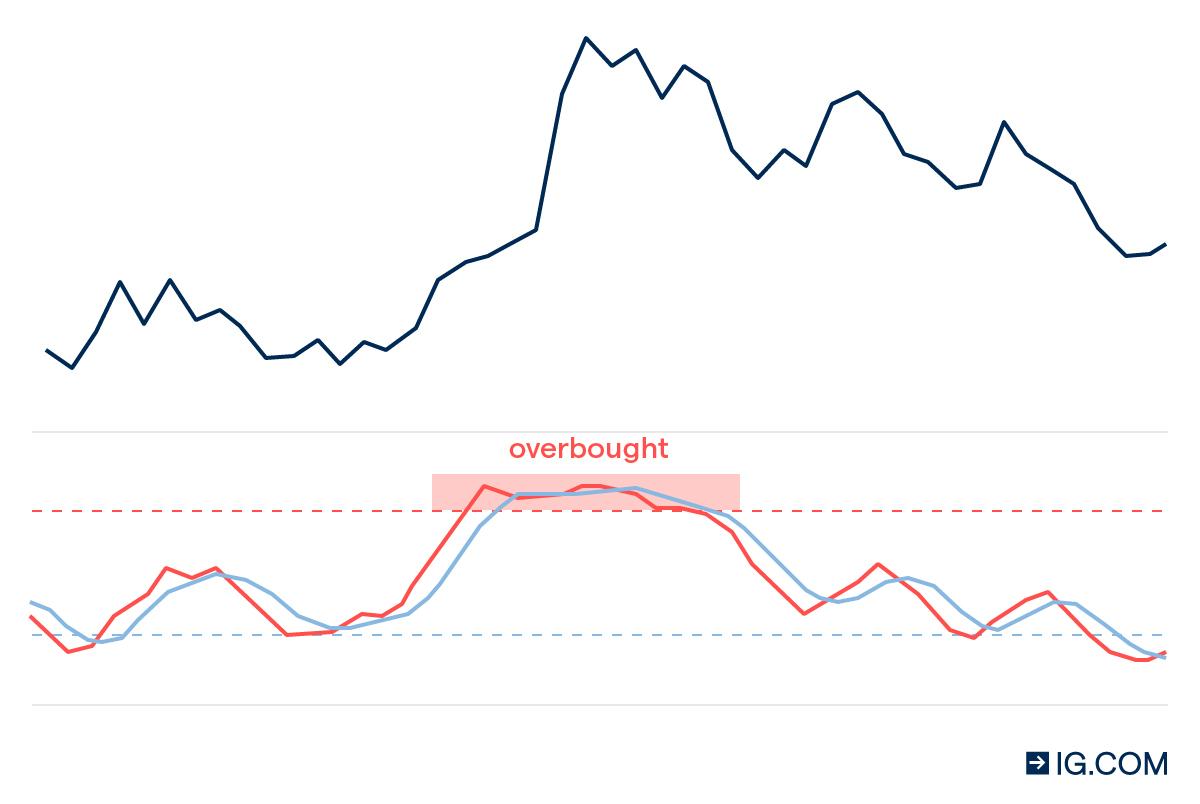
If the percentage is over 70, the market is generally considered overbought, and if it is under 30, it would normally be thought of as oversold.
It’s important to note that the RSI can stay above and below these points for a long time. It’s easy to just pick any top or bottom and assume the market will turn, but markets can remain overbought or oversold for longer than you’d expect.
When using the RSI, the key is to wait until the indicator level crosses back under 70 or above 30. This shows the market conditions are truly changing.
Learn more about using the relative strength index
Stochastic oscillator
The stochastic oscillator is used to compare the current price level of an asset to its range over a set timeframe – again, this is usually 14 periods.
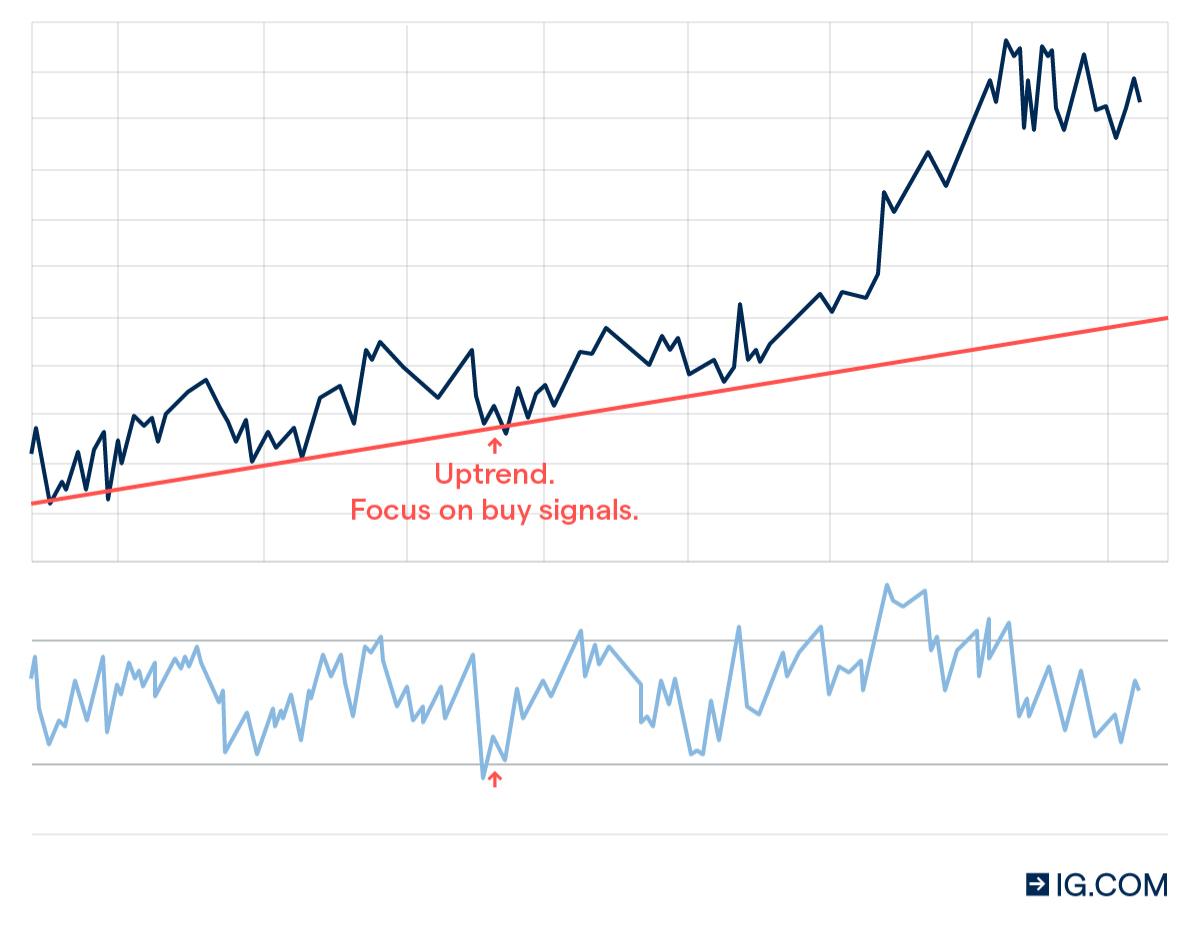
Within an uptrend, a market will tend to close nearer to its highs and in a downtrend, it would close nearer to its lows. When prices move away from these extremes and toward the middle of its price range, it is often a sign that the momentum is exhausted and likely to change direction.
Like the RSI, the stochastic moves on a scale between zero and 100. A stochastic value of over 80 usually indicates an overbought status, and a value of 20 or lower typically indicates oversold conditions.
The stochastic is also used alongside the RSI. As RSI levels can remain high or low for quite a while, by adding the stochastic it is possible to see when the momentum changes and prices start to move away from the extremities.
Discover how to use the stochastic oscillator
How to trade overbought and oversold levels
- Create a live trading account or a risk-free demo account
- Choose a market to trade
- Use the RSI or stochastic oscillator to identify overbought and oversold conditions
- Decide whether to go long or short
- Open your position, monitor the trend and close your trade
When you trade CFDs, you can go long or short on a huge range of markets, which makes them a great way speculate on overbought and oversold market conditions.
To take advantage of overbought levels, you would aim to identify the point at which the market reaches its highest extremity. At which point, you’d open a short position to take advantage of the market correcting to a lower price.
You’d take the opposite strategy for oversold levels – finding the bottom of a market, and opening a long position to take advantage of the impending upward move.
Remember, it is just as important to find exit levels for your trade, not just entry levels. Both the RSI and stochastic oscillator can be used to see when a trend is coming to an end, indicating it is time to close your trade.
With us, you can also attach stop-losses and limit-closes to your positions, which can close your trade when a specific price level is hit. While stop-losses enable you to cap your risk, limit-closes would help you lock in any profits earned.
Learn more about stops and limits
Overbought and oversold levels summed up
- Overbought and oversold levels are used to describe the price of an asset in relation to its fair value
- These levels are most commonly used in share trading, but also apply to other markets such as options, forex and commodities
- Overbought markets have seen significant price increases, leading to the asset becoming priced higher than it is actually worth. A period of downturn will likely follow
- Oversold markets experience sustained price decreased, causing the asset to be worth less than its true value. A market rally usually follows
- The best way to identify overbought and oversold levels is by using technical analysis – looking at price charts and indicators to highlight patterns in market movements
- Two popular overbought and oversold indicators are the relative strength index and stochastic oscillator
- It’s important to identify both entry and exit levels for trades
- Trading CFDs or spread betting enables you to speculate on rising and falling markets – making full use of overbought and oversold signals
IGA, may distribute information/research produced by its respective foreign affiliates within the IG Group of companies pursuant to an arrangement under Regulation 32C of the Financial Advisers Regulations. Where the research is distributed in Singapore to a person who is not an Accredited Investor, Expert Investor or an Institutional Investor, IGA accepts legal responsibility for the contents of the report to such persons only to the extent required by law. Singapore recipients should contact IGA at 6390 5118 for matters arising from, or in connection with the information distributed.
The information/research herein is prepared by IG Asia Pte Ltd (IGA) and its foreign affiliated companies (collectively known as the IG Group) and is intended for general circulation only. It does not take into account the specific investment objectives, financial situation, or particular needs of any particular person. You should take into account your specific investment objectives, financial situation, and particular needs before making a commitment to trade, including seeking advice from an independent financial adviser regarding the suitability of the investment, under a separate engagement, as you deem fit.
Please see important Research Disclaimer.

Explore the markets with our free course
Discover the range of markets you can trade on - and learn how they work - with IG Academy's online course.
