Heavy-lifting from US tech overnight as Nvidia’s results in focus ahead: US Technology Sector, Straits Times Index, Gold
The US 10-year Treasury yields touched a new 15-year high, but renewed traction towards tech shares ahead of Nvidia’s result release saw shrug-off from Nasdaq.


Market Recap
The US 10-year Treasury yields touched a new 15-year high overnight, but the Nasdaq managed to shrug it off for now (+1.6%), tapping on renewed traction towards tech shares ahead of Nvidia's result release tomorrow. Nvidia’s share price is up 8.5% overnight, reflecting some mounting bets in place for upcoming earnings to deliver. Current estimates from Refinitiv are looking for quarterly revenue to increase 67% year-on-year (est $11.2 billion versus $6.7 billion) and earnings per share to increase more than four-fold from a year ago (est $2.09 versus $0.51).
With Nvidia’s share price trading back near its all-time high, there are little room for disappointment and given that overnight gains are concentrated in the tech sector, any failure for Nvidia’s results to outperform on all fronts may translate to downside risks for the wider market. For now, as sentiments tread on some wait-and-see, the economic calendar today remains relatively quiet with US existing home sales data and Fedspeak in focus today.
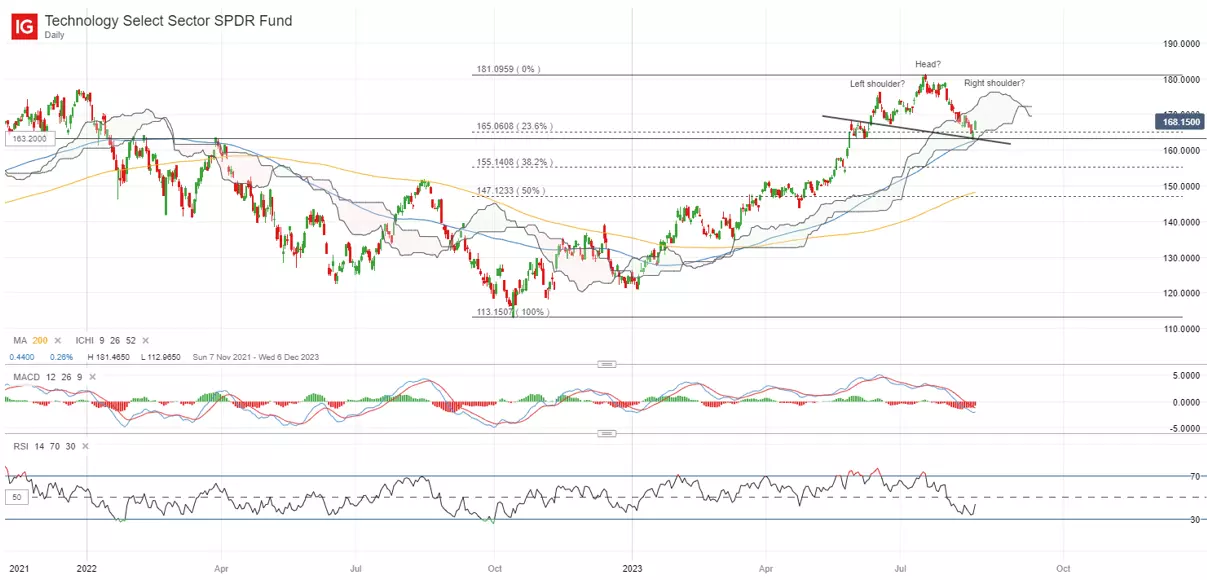
For the Technology Select Sector SPDR Fund, recent bounce follows upon a retest of a support confluence around the 163.20 level, where its 100-day moving average (MA) stands in coincidence with the lower edge of its Ichimoku cloud on the daily chart. While much is still up in the air, any formation of a lower high from its July 2023 peak may be on the lookout, as it may point to a potential head-and-shoulder formation. The 176.34 level may be a resistance level to overcome, while for now, buyers will attempt to defend the support confluence at the 163.20 level.
Asia Open
Asian stocks look set for a mixed open, with Nikkei +1.04%, ASX -0.18% and KOSPI +0.67% at the time of writing, as the concentration of gains in the US tech sector overnight brought greater pull-ahead in more growth-exposed indices. The Nasdaq Golden Dragon China Index rose 0.8% overnight but follows after a 17% sell-off since July 2023. The Hang Seng Index continues to trade near its 8-month low, with the 17,000 level on the radar as the next line of support.
Thus far, the economic surprise index for Asia Pacific continues to hover in negative territory – a divergence from the US, which is at its highest level since March 2021. Higher sensitivity to China’s economy for the region remains a drag, which could paint a low-for-longer growth outlook without signs of a turnaround in China’s economy just yet.
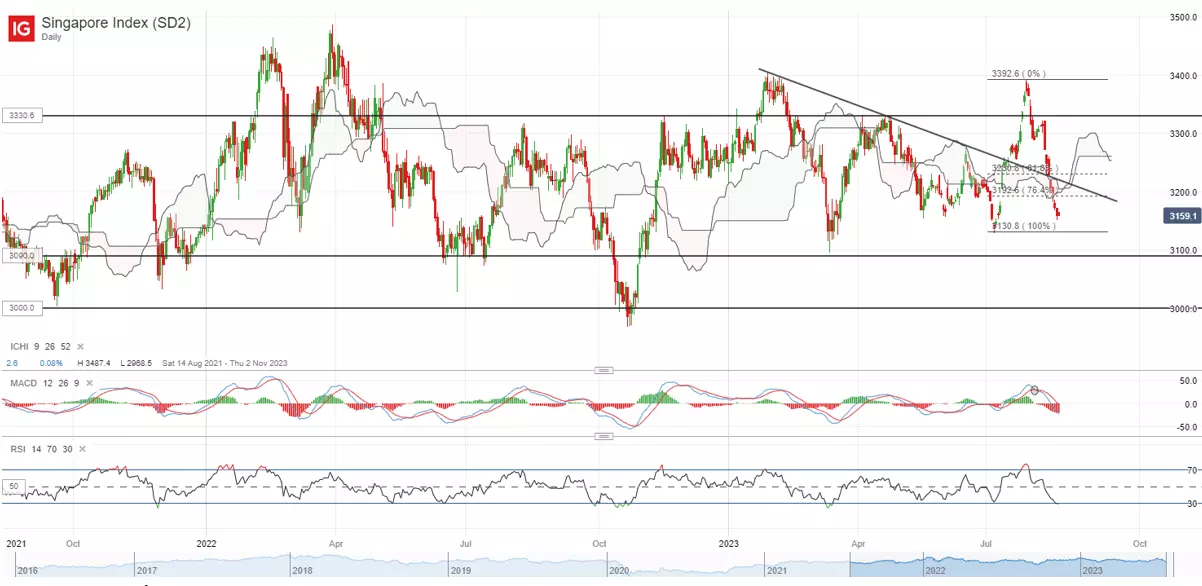
The Straits Times Index may be on the radar, with the index paring back most of its July gains to stand less than 2% away from its year-to-date low. The year-to-date low at the 3,090 level may be a support line to hold, failure to do so may pave the way to retest the key psychological 3,000 level next. On the upside, a series of resistance will have to be overcome, which includes a previous downward trendline resistance around the 3,200 level. On the broader scale, the index remains locked within a wide consolidation zone, as prevailing weakness in manufacturing activities nullifies services sector resilience.
On the watchlist: Gold prices attempting to stabilise but much awaits
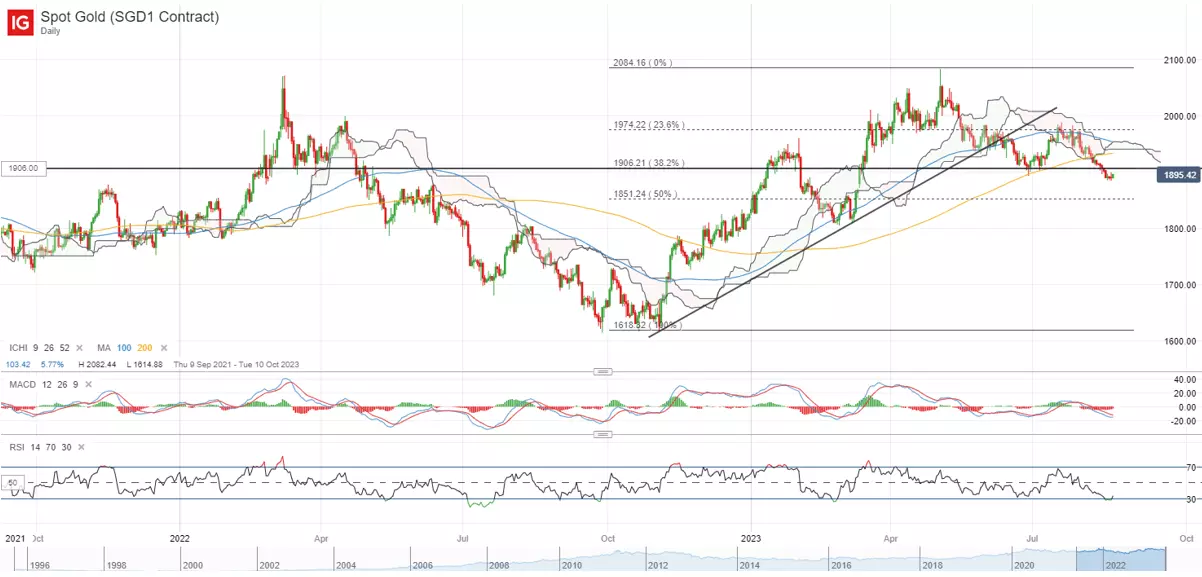
Gold prices continue to hover around its five-month low, attempting to stabilise from recent sell-off despite another upmove in Treasury yields overnight. A pause in the US dollar rally may provide a catalyst for some breather, along with a reversion from near-term oversold technical conditions.
That said, there are no clear signs of a reversal yet, with the yellow metal trading below its 200-day MA for the first time this year. Its weekly relative strength index (RSI) has also broken below the key 50 level for the first time since November 2022, which may still reflect sellers in greater control. Greater conviction for the bulls may have to come from a reclaim of its 200-day MA, while on the downside, the US$1,850 may be the next support level on the radar.
Monday: DJIA -0.11%; S&P 500 +0.69%; Nasdaq +1.56%, DAX +0.19%, FTSE -0.06%
IGA, may distribute information/research produced by its respective foreign affiliates within the IG Group of companies pursuant to an arrangement under Regulation 32C of the Financial Advisers Regulations. Where the research is distributed in Singapore to a person who is not an Accredited Investor, Expert Investor or an Institutional Investor, IGA accepts legal responsibility for the contents of the report to such persons only to the extent required by law. Singapore recipients should contact IGA at 6390 5118 for matters arising from, or in connection with the information distributed.
The information/research herein is prepared by IG Asia Pte Ltd (IGA) and its foreign affiliated companies (collectively known as the IG Group) and is intended for general circulation only. It does not take into account the specific investment objectives, financial situation, or particular needs of any particular person. You should take into account your specific investment objectives, financial situation, and particular needs before making a commitment to trade, including seeking advice from an independent financial adviser regarding the suitability of the investment, under a separate engagement, as you deem fit.
No representation or warranty is given as to the accuracy or completeness of this information. Consequently, any person acting on it does so entirely at their own risk. Please see important Research Disclaimer.
Please also note that the information does not contain a record of our trading prices, or an offer of, or solicitation for, a transaction in any financial instrument. Any views and opinions expressed may be changed without an update.

Seize a share opportunity today
Go long or short on thousands of international stocks.
- Increase your market exposure with leverage
- Get spreads from just 0.1% on major global shares
- Trade CFDs straight into order books with direct market access
Live prices on most popular markets
- Forex
- Shares
- Indices
See more forex live prices
See more shares live prices
Prices above are subject to our website terms and agreements. Prices are indicative only. All shares prices are delayed by at least 15 mins.
See more indices live prices
Prices above are subject to our website terms and agreements. Prices are indicative only. All shares prices are delayed by at least 20 mins.
