FOMC headlines a huge week, and what next for the S&P 500
In preparation for the release of the FOMC data on December 15, IG analyst Tony Sycamore explores what's next for the S&P 500.

The holiday season is fast approaching.
However, before traders can take a well-earned break, a huge week lies ahead, including critical central bank interest rate meetings—chief amongst them Thursday morning’s FOMC meeting.
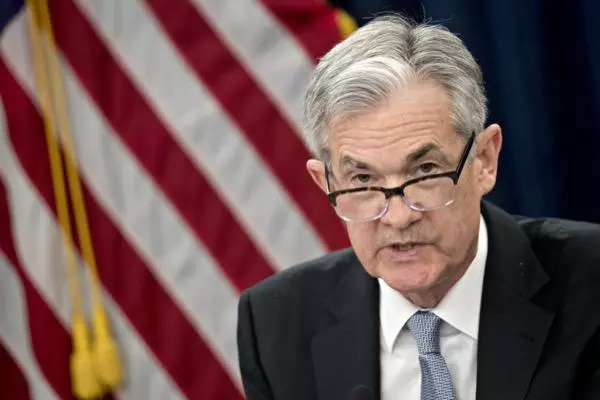
Following a downside surprise in U.S inflation in October, Fed Chair Powell, speaking at the Brookings Institute on November 30th, indicated that the pace of Fed tightening was set to slow from 75bp to 50bp.
He stated, “It makes sense to moderate the pace of our rate increases as we approach the level of restraint that will be sufficient to bring inflation down.” This is a “good way to balance the risks” to the economy.
The markets have taken the Fed Chairs message at face value, and the interest rate market expects the Fed Funds rate to rise on Thursday by 50bp to a range of 4.25-4.50%.
Aside from the actual rate rise, the focus will be on the tone and content of the accompanying press conference and the projected peak for the Fed Funds rate in 2023.
The impressive rally in stock and bond markets, along with a sell-off in the US dollar since mid-October, has resulted in a substantial easing in financial conditions.
An easing in financial conditions is counterproductive to the Fed's aims of taming inflation and cooling the labour market. As such, the tone of the Fed Chairs press conference is expected to sound more hawkish than his speech at the Brookings institute.
There is some conjecture about whether the median Feds dot plot peak will be raised to 4.875% or 5.125%. The latter would provide the Fed with more optionality around balancing the risks of inflation verse recession.
What do the charts say?
The rally in the S&P 500 from the October 3502 low tagged to perfection the downtrend resistance at 4110, coming from the January 4808 high, and is viewed as countertrend.
The S&P 500 needs to see a sustained break above the 4100/4110 resistance zone, post the FOMC, to negate the downside risks and to suggest a more robust recovery towards the 61.8% retracement at 4310 is underway.
On the downside, a sustained break of near-term support at 3910/00, post the FOMC meeting, would likely set up a test of support 3750 area.
S&P 500 daily chart

Take your position on over 16,000 local and international shares via CFDs – and trade it all seamlessly from the one account. Learn more about trading share CFDs with us, or open an account to get started today.
IGA, may distribute information/research produced by its respective foreign affiliates within the IG Group of companies pursuant to an arrangement under Regulation 32C of the Financial Advisers Regulations. Where the research is distributed in Singapore to a person who is not an Accredited Investor, Expert Investor or an Institutional Investor, IGA accepts legal responsibility for the contents of the report to such persons only to the extent required by law. Singapore recipients should contact IGA at 6390 5118 for matters arising from, or in connection with the information distributed.
The information/research herein is prepared by IG Asia Pte Ltd (IGA) and its foreign affiliated companies (collectively known as the IG Group) and is intended for general circulation only. It does not take into account the specific investment objectives, financial situation, or particular needs of any particular person. You should take into account your specific investment objectives, financial situation, and particular needs before making a commitment to trade, including seeking advice from an independent financial adviser regarding the suitability of the investment, under a separate engagement, as you deem fit.
No representation or warranty is given as to the accuracy or completeness of this information. Consequently, any person acting on it does so entirely at their own risk. Please see important Research Disclaimer.
Please also note that the information does not contain a record of our trading prices, or an offer of, or solicitation for, a transaction in any financial instrument. Any views and opinions expressed may be changed without an update.

Take a position on indices
Deal on the world’s major stock indices today.
- Trade the lowest Wall Street spreads on the market
- 1-point spread on the FTSE 100 and Germany 40
- The only provider to offer 24-hour pricing
Live prices on most popular markets
- Forex
- Shares
- Indices
See more forex live prices
See more shares live prices
Prices above are subject to our website terms and agreements. Prices are indicative only. All shares prices are delayed by at least 15 mins.
See more indices live prices
Prices above are subject to our website terms and agreements. Prices are indicative only. All shares prices are delayed by at least 20 mins.
