Asia Day Ahead: Sentiments on hold for Fed meeting, China’s loan prime rate in focus
Further de-risking took hold of Wall Street, as the usual caution persisted ahead of the FOMC meeting. Treasury yields resumed their ascent to retest their multi-year highs.


Market Recap
Further de-risking took hold of Wall Street overnight, as the usual caution persisted in the lead-up to the Federal Open Market Committee (FOMC) meeting, albeit with some paring of losses into the latter half of the session. Treasury yields resumed their ascent to retest their multi-year highs, seemingly reflecting increased positioning for a hawkish-pause scenario from the Federal Reserve (Fed). Both the US two-year and ten-year yields touched its highest level in 16 years, both rising by around 4.7 basis-point (bp) to reach 5.109% and 4.365% respectively.
This comes as a gridlock over spending bills in Congress brought renewed risks of a US government shutdown, with the tendency for policymakers to use time pressures to better further their aims potentially keeping sentiments on some unease in the lead-up to its deadline of 30 September 2023.
At least for now, attention will be concentrated on the upcoming Fed meeting, with rate expectations leaning towards a prolonged rate hold from the Fed, which seems to misalign with policymakers’ views of one additional hike by the end of this year. Focus will be on whether the fresh economic projections are able to provide the much-needed conviction for market participants that the Fed’s call for additional tightening will be followed through.
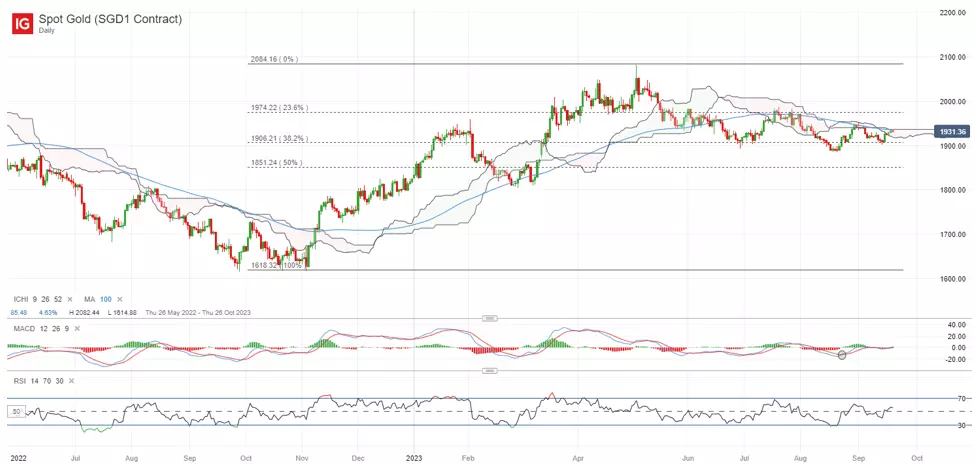
Elevated real Treasury yields have been a key headwind for gold prices, but some signs of life were seen lately, with the yellow metal’s prices edging higher to retest the upper edge of its Ichimoku cloud on the daily chart. Much will still depend on whether we can see a successful break above the cloud zone, with prices failing to do since June this year. Immediate resistance to watch may be at US$1,950 level, while the US$1,900 level will be a key support to hold for buyers.
Asia Open
Asian stocks look set for a subdued open, with Nikkei -0.26%, ASX -0.44% and KOSPI +0.18% at the time of writing. Ahead, China’s loan prime rate will be in focus, with broad expectations looking for a no-change, following last week’s inaction on the Medium-term Lending Facility (MLF) rate by the People's Bank of China (PBoC). Given some positive surprises in economic data reflecting initial success in supportive policies lately, it also provides room for authorities for some wait-and-see. Any cuts may come as a surprise, which could arguably instil some alarm of a more lacklustre recovery instead.
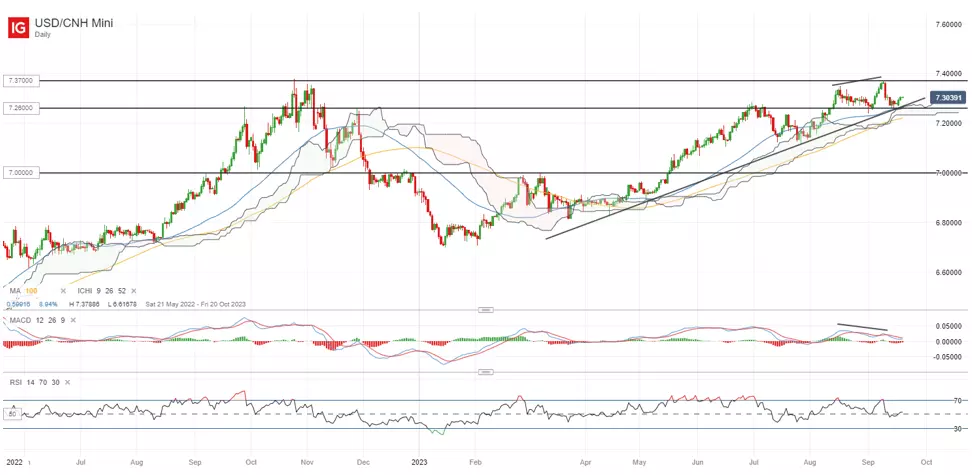
The USD/CNH may be in focus, having defended its support confluence at the 7.260 level lately, following a short retracement from its November 2022 high. This level is where an upward trendline support stands alongside its 50-day moving average (MA). For now, the broader upward trend remains in place, with the pair still trading above its Ichimoku cloud pattern on the daily chart, guided by a series of higher highs and higher lows since the start of the year. Any breakdown of the key 7.260 level may leave the 7.190 level on watch next, while on the upside, the year-to-date high at the 7.370 level will be a key resistance to overcome.
On the watchlist: Natural gas prices attempting for a break above a key psychological level
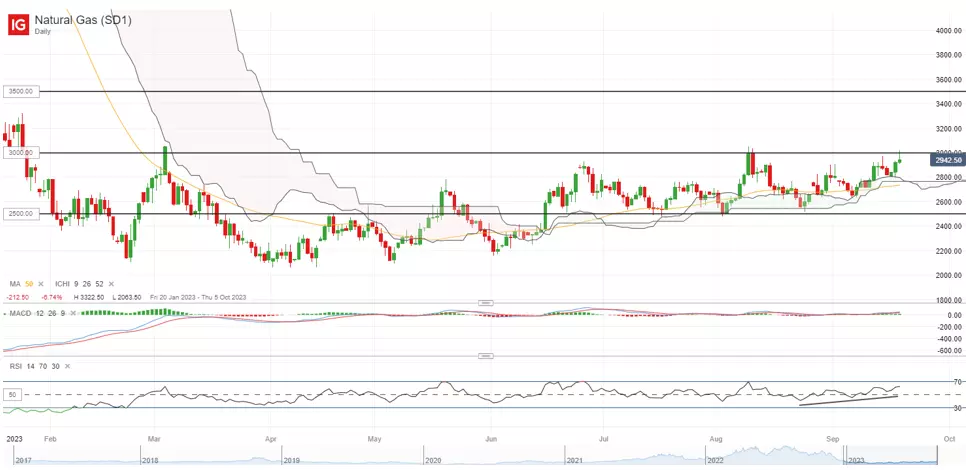
US natural gas prices have gained for the second straight day to a one-month high this week, attempting for a break above its key psychological $3.00/MMBtu mark due to a drop in daily output, along with some positive spillover effect from higher oil prices lately. While some resistance have surfaced at this level overnight with the formation of a bearish shooting star on the daily chart, the higher highs and higher lows formation since late-August this year may still reflect some control from buyers, with prices still defending its Ichimoku cloud support since June this year.
Any successful reclaim of the $3.00/MMBtu level ahead may support a move to retest the $3.50/MMBtu next, with projection based on a breakout of the current ranging pattern. On the downside, the daily Ichimoku cloud has proven to be a key support zone for buyers, which leaves the $2.80/MMBtu as an immediate support to hold.
Tuesday: DJIA -0.31%; S&P 500 -0.22%; Nasdaq -0.23%, DAX -0.40%, FTSE +0.09%
IGA, may distribute information/research produced by its respective foreign affiliates within the IG Group of companies pursuant to an arrangement under Regulation 32C of the Financial Advisers Regulations. Where the research is distributed in Singapore to a person who is not an Accredited Investor, Expert Investor or an Institutional Investor, IGA accepts legal responsibility for the contents of the report to such persons only to the extent required by law. Singapore recipients should contact IGA at 6390 5118 for matters arising from, or in connection with the information distributed.
The information/research herein is prepared by IG Asia Pte Ltd (IGA) and its foreign affiliated companies (collectively known as the IG Group) and is intended for general circulation only. It does not take into account the specific investment objectives, financial situation, or particular needs of any particular person. You should take into account your specific investment objectives, financial situation, and particular needs before making a commitment to trade, including seeking advice from an independent financial adviser regarding the suitability of the investment, under a separate engagement, as you deem fit.
No representation or warranty is given as to the accuracy or completeness of this information. Consequently, any person acting on it does so entirely at their own risk. Please see important Research Disclaimer.
Please also note that the information does not contain a record of our trading prices, or an offer of, or solicitation for, a transaction in any financial instrument. Any views and opinions expressed may be changed without an update.

Seize a share opportunity today
Go long or short on thousands of international stocks.
- Increase your market exposure with leverage
- Get spreads from just 0.1% on major global shares
- Trade CFDs straight into order books with direct market access
Live prices on most popular markets
- Forex
- Shares
- Indices
See more forex live prices
See more shares live prices
Prices above are subject to our website terms and agreements. Prices are indicative only. All shares prices are delayed by at least 15 mins.
See more indices live prices
Prices above are subject to our website terms and agreements. Prices are indicative only. All shares prices are delayed by at least 20 mins.
