Asia Day Ahead: Risk-on continues as US dollar struggles, oil extend gains
Recent attempt from Fed officials to downplay rate-cut prospects failed to dampen market optimism, with Wall Street extending its gains for the second straight day this week.


Market Recap
Recent attempt from Federal Reserve (Fed) officials to downplay rate-cut prospects failed to dampen market optimism, with Wall Street extending its gains for the second straight day this week. Market participants have been shrugging off Fed’s comments thus far, as the trend of easing US inflation continues to feed into expectations for a Fed’s rate cut as early as March next year, alongside the six rate cuts priced for 2024 versus the Fed’s guidance of three cuts. It seems that markets will be holding on to such views, until we have a reversal in inflation trend to the upside to challenge such dovish expectations.
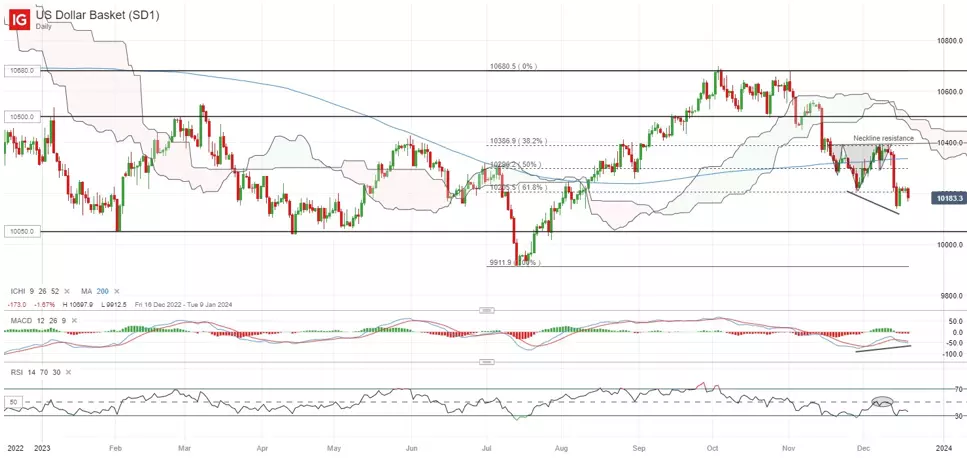
For now, the US dollar struggled to keep up with its recent recovery, seemingly setting its sight back on its December low, as Treasury yields failed to find much pick-up this week as well. The prospect of a near-term bullish divergence on moving average convergence/divergence (MACD) for the US dollar may remain, but we may have to see more follow-through in terms of recovery to support that. Immediate resistance to overcome stands at the 102.30 level, while on the downside, the December low at the 101.40 level will be key support to defend from buyers, having marked with some dip-buying back in August this year.
Asia Open
Asian stocks look set for a positive open, with Nikkei +1.67%, ASX +0.52% and KOSPI +1.00% at the time of writing. A dovish takeaway from the Bank of Japan (BoJ) meeting has brought much cheers for Japanese equities, with the Nikkei 225 index setting its sight to retest its year-to-date high at the 34,000 level once more.
Chinese equities are also regaining some traction, with the Nasdaq Golden Dragon China Index up 1.8% overnight, but a clear recovery trend in economic conditions may still be needed to sustain any gains ahead. For now, China authorities have kept its one-year and five-year loan prime rate unchanged earlier today, which is in line with market expectations. Further accommodative policies remains on the lookout into next year to stabilise growth, amid the on-and-off recovery momentum that we have seen over the past months thus far.
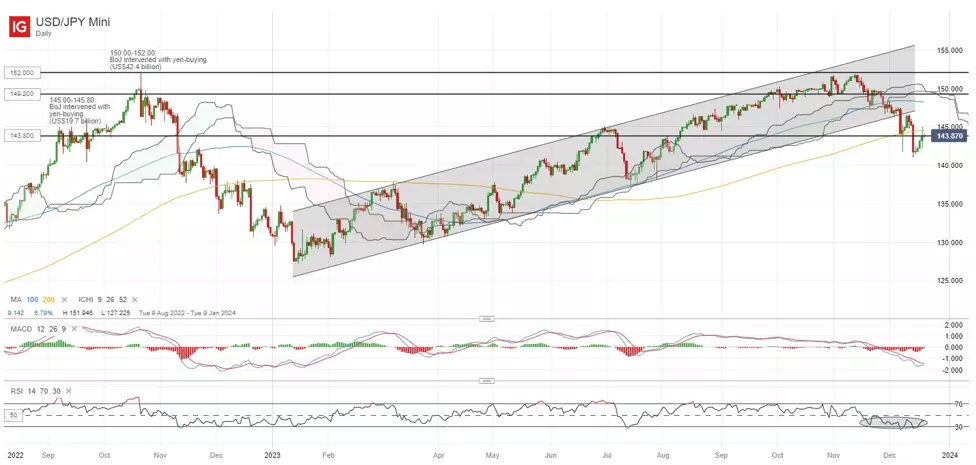
Speculators expecting a more hawkish shift in policy wording from the BoJ are disappointed yesterday with the central bank delivering little surprise, choosing to stick to its muddled script for any policy exit. The USD/JPY has managed to pare some earlier losses, but the broader trend seems likely to remain on the downside. This comes as the pair has broken below its Ichimoku cloud support on the daily chart for the first time since April this year, alongside with a rising channel breakdown earlier this month. The 145.20 level will serve as immediate resistance to overcome, failing which may pave the way to retest its December low at the 141.50 level.
On the watchlist: Oil prices continue its recovery on Red Sea shipping disruption
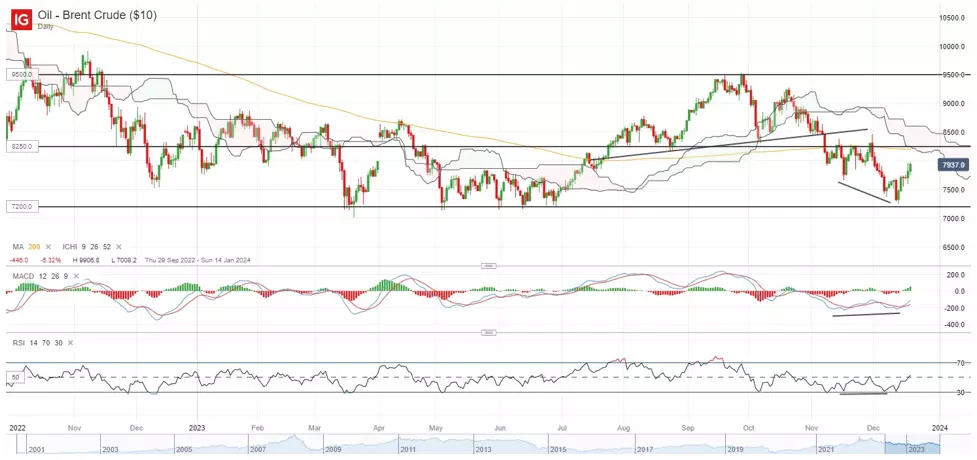
Oil prices continue to extend its gains for the fifth straight trading day, as the US-led naval mission to mitigate Houthis’ attacks failed to ease concerns of safe passage through the Red Sea, with major maritime carriers still choosing to steer clear amid the tensions. Extreme bearish bets on oil over the past months may contribute to the extended gains as well, with huge room for some near-term unwinding on oversold technical conditions.
For now, the daily relative strength index (RSI) for Brent crude is attempting to cross back above the 50 level but several resistance overhead remains key to overcome. This includes its 200-day moving average (MA), which held prices down on three occasions in November this year, along with the Ichimoku clod resistance on the daily chart.
Tuesday: DJIA +0.68%; S&P 500 +0.59%; Nasdaq +0.66%, DAX +0.56%, FTSE +0.31%
IGA, may distribute information/research produced by its respective foreign affiliates within the IG Group of companies pursuant to an arrangement under Regulation 32C of the Financial Advisers Regulations. Where the research is distributed in Singapore to a person who is not an Accredited Investor, Expert Investor or an Institutional Investor, IGA accepts legal responsibility for the contents of the report to such persons only to the extent required by law. Singapore recipients should contact IGA at 6390 5118 for matters arising from, or in connection with the information distributed.
The information/research herein is prepared by IG Asia Pte Ltd (IGA) and its foreign affiliated companies (collectively known as the IG Group) and is intended for general circulation only. It does not take into account the specific investment objectives, financial situation, or particular needs of any particular person. You should take into account your specific investment objectives, financial situation, and particular needs before making a commitment to trade, including seeking advice from an independent financial adviser regarding the suitability of the investment, under a separate engagement, as you deem fit.
No representation or warranty is given as to the accuracy or completeness of this information. Consequently, any person acting on it does so entirely at their own risk. Please see important Research Disclaimer.
Please also note that the information does not contain a record of our trading prices, or an offer of, or solicitation for, a transaction in any financial instrument. Any views and opinions expressed may be changed without an update.

Seize a share opportunity today
Go long or short on thousands of international stocks.
- Increase your market exposure with leverage
- Get spreads from just 0.1% on major global shares
- Trade CFDs straight into order books with direct market access
Live prices on most popular markets
- Forex
- Shares
- Indices
See more forex live prices
See more shares live prices
Prices above are subject to our website terms and agreements. Prices are indicative only. All shares prices are delayed by at least 15 mins.
See more indices live prices
Prices above are subject to our website terms and agreements. Prices are indicative only. All shares prices are delayed by at least 20 mins.
